Contents
The Securitization of Intelligence
A Market Operator's Map of the AI Boom, 2026–2028
Paul Vilevac — bleenq intelligence Working paper v2.4 — August 17, 2026 (published edition). Revision history: the companion changelog — published with the paper — records every revision — self-corrections at the same prominence as additions — and publishes with the paper. v2.1 is the publication pass: it absorbs a commissioned adversarial review (“The Counterparty Brief,” same date) — the clock claim rewritten as a dated forecast, the credit-market counter-exhibit added at full prominence, demand split into level and slope, the $1.65T aggregate demoted to a labeled secondary pending reproduction, and the buyback/issuance objection resolved in text.
Disclaimers, caveats, and safe harbor#
The author is not a financial advisor, and nothing in this paper is investment advice, an offer, or a solicitation. This is a personal research synthesis: a working map of one operator’s theses, positions of interest, and measurement systems, published for discussion and calibration. The author may hold, acquire, or exit positions in any security mentioned, at any time, without notice. All figures were compiled from public primary sources (SEC EDGAR, TreasuryDirect, BLS, company disclosures) and public reporting as of the dates noted; errors are possible and corrections are welcome. Forward-looking statements herein are expressly speculative, carry material uncertainty, and are pre-registered with falsification criteria precisely because the author expects some of them to be wrong. Past performance — of markets, of analogies, and of the author’s own predictions journal — does not guarantee future results. Do your own research; size anything you do to survive being wrong.
Index#
- Part 0 — Why this paper (the ten claims in brief, and the circuit that unifies them)
- Part I — The Regime: two branches, the melt-up, and the tells
- Part II — The Money: fiscal dominance and the machinery of “dare not tighten”
- Part III — The Machine: what the filings say the AI buildout actually is
- Part IV — The Securitization Phase: the housing arc, compressed
- Part V — The Demand Question: the layer where the base rates rot
- Part VI — Innovation vs. Productivity: the dynamo thesis and the K
- Part VII — The Valuation Lens: what prices imply, in numbers
- Part VIII — Positioning: the horizon barbell
- Part IX — Falsification: what kills each pillar, and how we score ourselves
- About the author
- Appendix A — Watchlists (the webs)
- Appendix B — Claim files in brief
- Appendix C — Methods: the primary-source pipelines
- Appendix D — Predictions journal and calibration (excerpts)
- Appendix E — References and source notes
- Appendix F — Open review register
Part 0 — Why this paper#
In mid-2024, an essay called Situational Awareness argued that a small circle of people could see the shape of the decade in the AI labs’ scaling curves. This paper is the market-side counterpart, written from a different vantage: not what the models will become, but what the money is doing while everyone argues about what the models will become — and what an individual operator can measure, position for, and be honestly wrong about.
The method matters as much as the conclusions. Every load-bearing claim in this paper traces to a primary source an individual can pull for free — 10-Q commitment schedules, Treasury auction internals, Form 4 insider filings, XBRL balance-sheet frames — and every forecast is pre-registered in a predictions journal with resolution criteria and dates, scored honestly after the fact. The author’s own calibration record (Appendix D) shows a specific edge shape: fundamentals and regime calls resolve well; short-horizon price choreography resolves poorly. The paper leans on the former and mechanizes the latter.
The ten claims, in brief:
- The market is in a melt-up regime (“Branch B”), structurally fueled and policy-extended — not a healthy bull leg, and not yet a topping process.
- US monetary policy is functionally fiscally dominated: the Fed cannot tighten hard into sticky inflation without detonating a financing structure that now rolls ~$6T per quarter — so real rates stay pinned and hard assets bid.
- The AI buildout is real at the contract layer. The filings — not the narratives — show secured multi-year supply: purchase commitments doubling in out-years, gigawatt-scale power deals, take-or-pay backlogs.
- The buildout has entered its securitization phase. Compute-collateralized SPV debt at half-trillion scale is the 2004–05 analog of the housing arc, arriving on an accelerated clock.
- The demand base beneath the enterprise layer is rotting on schedule: project abandonment tripled year-over-year, insurance is carving out AI liability, and realized enterprise value remains mostly labor arbitrage.
- Labor-arbitrage AI amplifies the K-shaped economy; its margin gains accrue to capital, which is precisely why capital is pushing it.
- Durable AI value accrues to innovators, not efficiency-seekers — the dynamo thesis: value arrives when production is redesigned around the technology, not when the old floor plan gets cheaper labor.
- The infrastructure toll decays. Capability-adjusted inference prices deflate ~10x/year; the perpetual-rent configuration of 2026 is not the equilibrium, and the eventual repricing lands on levered infrastructure and its creditors — not primarily on the toll’s current king.
- The probable break window is late 2027 to early 2028 (housing-arc arithmetic, Gartner’s own cancellation timestamps, and the 2027 concentration of commitment cliffs) — with the honest error bars wide, and the credit market’s early warnings (record CDS on the sector’s flagship) arguing the compressed cycle could break sooner.
- The right posture is a horizon barbell: rent the production layer mechanically while the melt-up pays, own screened innovators for the decade, keep cash-backed ballast, and let pre-registered tells — not vibes — call the turn.
Why now#
A paper built from dated claims has a shelf life, and it runs opposite to the usual publishing risk: every week this document stays private, its pre-registrations get cheaper. A forecast published after the evidence is a memoir. The calendar makes the point concrete — the fortnight after publication is the densest information window of the year, and it thickened in the paper’s final days: the market’s new pre-market options venue opens on this paper’s own cast the morning we publish (August 17); the FOMC minutes land the same day the VIX expiration begins un-pinning the tape (the 19th), with monthly expiration completing the un-pinning (the 21st); NVIDIA’s filings and the PCE print arrive together on the 26th — the same day as Governor Cook’s removal-response deadline, the eve of Jackson Hole; and the new Fed chair delivers his first symposium speech (the 27th–29th) with financial conditions at their easiest since 1996 and his delegated-tightening framework publicly unwound beneath him. Publishing days before that window means the claims get graded in public, almost immediately, by primary documents no one can spin retroactively. (An earlier draft of this section counted a fourth dated disclosure — a Treasury statement on the yen operation expected August 30. That date did not survive re-verification; the correction is in the changelog, and the gauntlet is three disclosures. We are publishing into it anyway.) That is not bravado; it is the only condition under which the pre-registrations in Appendix D are worth the paper they are printed on.
The second reason is that direction has stopped being scarce. In the weeks this paper closed, the bear case became a product: it is now sold as courses, funnels, prime-time cable segments and subscription communities, with the public bears distributed neatly across dates — early 2027, our 2027 commitment season, 2028. When a conclusion is crowded, the residual value migrates to what crowded conclusions never carry: kill conditions with dates, forks that name what would prove us wrong, and a commissioned counter-argument published beside the argument at equal prominence. This paper publishes now not to join a chorus but to put the falsifiable version on the record while the unfalsifiable versions fill the feed — and because Part VII’s own epistemics section warns that a thesis this popular must earn its keep through discipline the popularity cannot counterfeit.
The third reason is the title. For most of the drafting, “the securitization of intelligence” was an interpretation — an argument that the boom’s financing was assembling itself into tranches. In the paper’s final week it stopped being an interpretation: the sellers declared the asset class on television, a private-capital principal described securitizing the revenue stream “to investors who want to participate anywhere in that stack,” the man who built mortgage securitization named his own precedent as a recommendation, and the securities regulator quietly exempted the collateral from the crisis-era rules written for its ancestor. The window in which the assembly can be documented from primary sources while it assembles is narrow. Afterward, everyone will have known all along; beforehand, the evidence was thin. Mid-assembly is the only moment a map like this is both drawable and still capable of being wrong — and being falsifiable is the only condition under which being right will mean anything.
The last reason is autobiographical, and it doubles as a disclosure the reader is owed. The author did not sit out the AI trade on principle and then write a paper to justify the seat. He took it — an AMD position entered December 26, 2025 on a conviction of undervaluation, held through a double-digit drawdown that tested the conviction, and exited May 18, 2026 at nearly twice the entry price; both legs since verified against the broker statements — and then assembled an AI basket from a long watchlist, and could not hold it: a thirty-year rule of thumb that distrusts any stock over thirty times earnings forced him out of names whose multiples had no floor under them that his discipline could see. What followed was cash, and a plan the author now recognizes as naive — wait for the crash that was surely imminent, then buy the wreckage. The crash did not come. The waiting became building: the mental model of three decades — innovation first, then who leverages it, then the macro, the news, the fundamentals, and only then the chart — got codified into pipelines, backtests, and registers, using the same AI tools this paper examines. And the machine’s first material result was to falsify its author’s prior: the evidence would not support “imminent.” It supported a financing structure with a schedule, and the schedule said late 2027 to early 2028. Claim 9 is not the author’s instinct written down; it is what his instinct was corrected to, by the pipeline, in public. The reader should weigh the paper knowing its author started more bearish than its conclusion and was argued off that position by his own evidence — because a map that can move its own maker is the only kind worth holding to its dates.
For the reader, the answer is simpler. You do not need to share these conclusions to use this equipment. The spiral checklist, the dated forks, the adjudicators printed on calendars, the antithesis carried at full strength — all of it works as well for a bull as for a bear, starting the morning you read it. What we ask is not agreement; it is that you hold us to the dates.
The circuit — the ten claims as one machine#
The claims read as a list; the thesis is not a list. It is a single self-reinforcing circuit, and every Part of this paper is one arc of it:
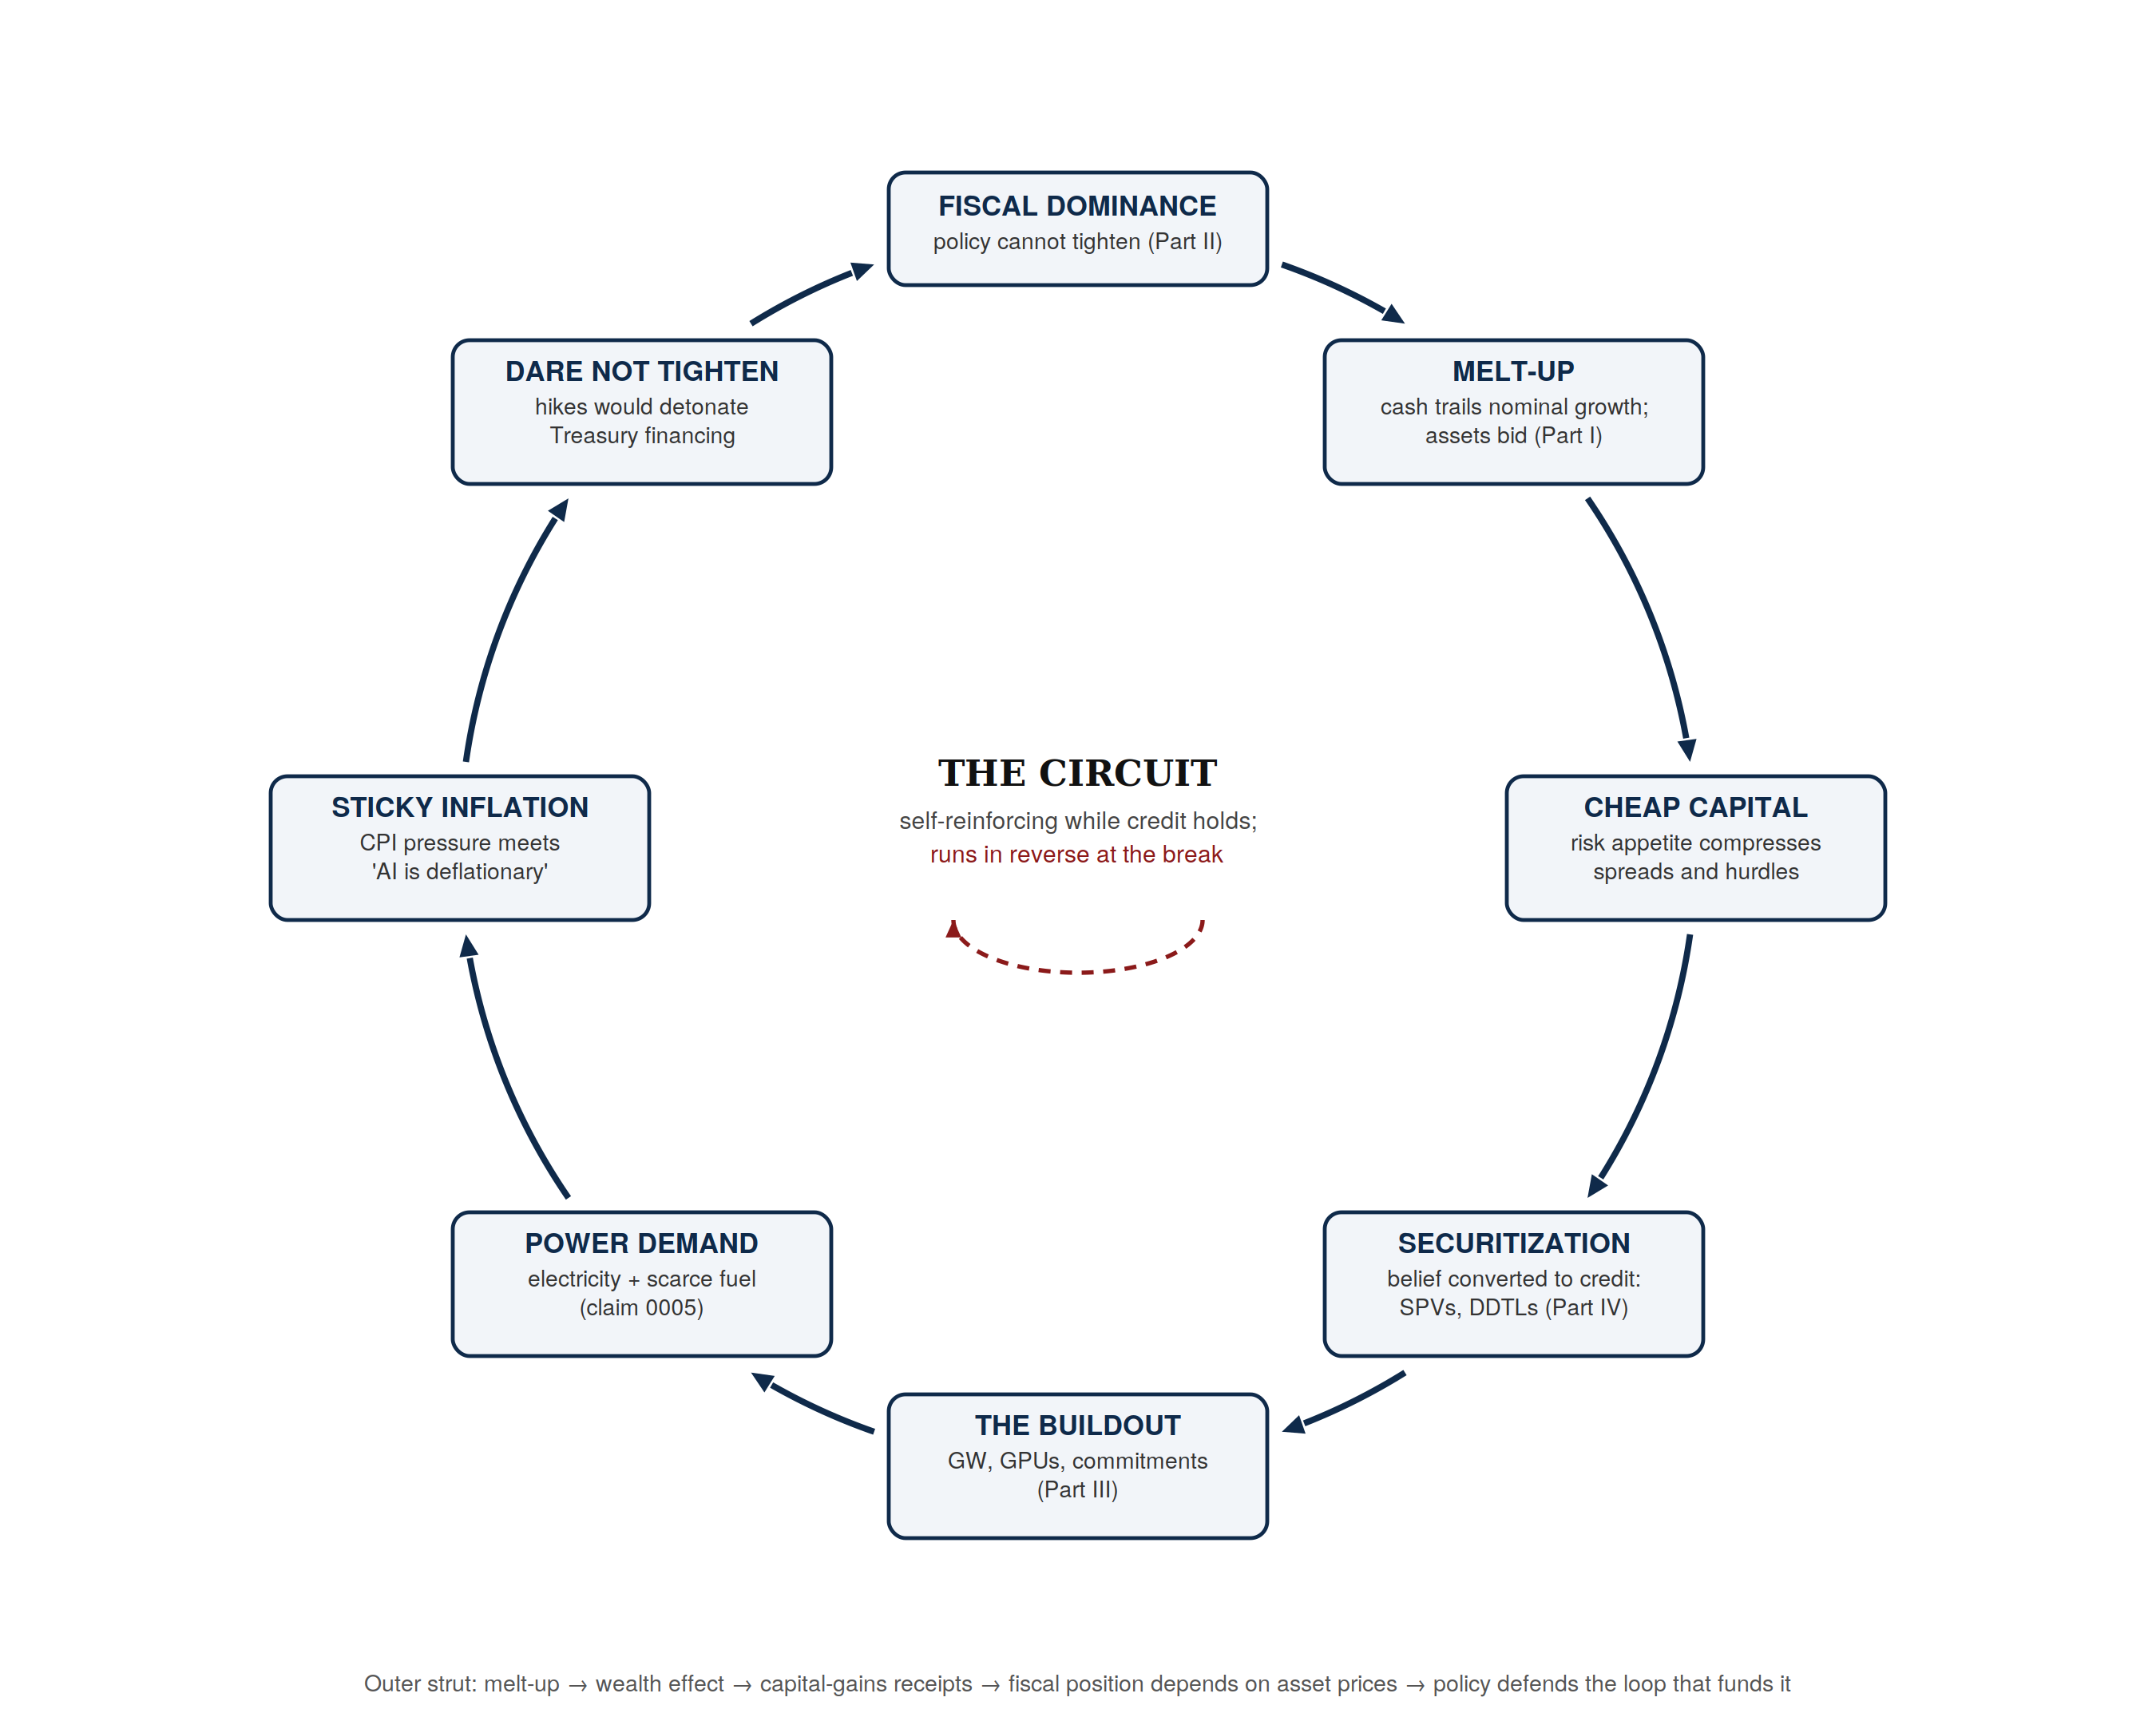
A fiscal system that cannot tighten is financing — through a credit machine it does not regulate — a buildout whose own power demand feeds the inflation that keeps the system from tightening. Trace it: fiscal dominance pins policy (Part II) → cash trails nominal growth, so assets bid — the melt-up (Part I) → risk appetite makes capital cheap → the securitization machinery converts belief into credit (Part IV) → credit funds the buildout’s gigawatts and commitments (Part III) → the buildout consumes power, pressuring electricity prices and CPI (Part III, claim 0005) → sticky inflation meets a Fed that cannot hike into the Treasury’s financing needs → back to fiscal dominance. A second strut braces the loop from outside: the melt-up’s wealth effect feeds capital-gains receipts and top-decile consumption, making the fiscal position itself dependent on asset prices — so policy defends the loop that funds it. Each arc taken alone is a defensible mainstream observation; the claim of this paper is that they are connected in series, which is why the configuration is stable enough to run for years — no single arc has to be extreme for the loop to compound.
It also explains the exit’s violence, because the same circuit runs in reverse. A credit event anywhere on the loop — an SPV repricing, a failed refinancing, a demand shock reaching hyperscaler revenue — withdraws capital; the buildout stalls; commitments meet collateral repricing; credit stress feeds equity; the wealth effect reverses into the fiscal position; and a system that could not tighten on the way up cannot passively absorb deflation on the way down. The endgame choice at the bottom of the reverse loop — accept the collapse or print against it — is asymmetric under fiscal dominance, which is the deepest reason the ballast leg of Part VIII is denominated the way it is. Parts V–VII locate where on the loop the stress is accumulating (demand rot, priced expectations); Part IX pre-registers what snapping looks like.
Part I — The Regime: two branches, the melt-up, and the tells#
The two-branch model#
Since July 2026 the operating framework has been a fork, not a forecast:
- Branch A — the break: a fiscal/financial accident — a failed duration auction into heavy rollover weeks, a disorderly unwind of the hedge-fund basis trade (the marginal Treasury buyer, running extreme repo leverage), or an external trigger — cascades through an over-concentrated, margin-levered equity market. The playbook for Branch A is a staged re-entry plan and a whale-fall shopping list, prepared in advance.
- Branch B — the melt-up (crack-up boom): the same fiscal pressures resolve, for a time, in the other direction: policy dare not tighten, cash yields trail nominal growth, money distrusts cash, and assets melt up. Mises’ crack-up boom; 1999’s last five months.
A melt-up is not a forecastable event but a confirmable configuration, and in the week of August 3–7, 2026, the configuration confirmed: the dollar had its worst week in three months while yields drifted lower, gold rose 2.5% to two-month highs with central banks (Bank of Korea, after a 13-year absence) buying physical, equities sat at records, and a negative payroll print (−23K, the cycle’s first) was bought within minutes as “hikes can wait.” Bad news trading as good news is the melt-up’s signature: liquidity logic replacing growth logic.
What a melt-up is, and how it’s traded#
A melt-up is a late-cycle acceleration where prices rise on deteriorating quality of demand — FOMO, forced repositioning, and liquidity seeking a home rather than improving fundamentals. It is the mirror of a crash: same reflexivity, opposite sign. The classic references (1928–29, Japan 1989, Nasdaq October 1999–March 2000, arguably late 2021) share three properties: they are real and richly tradeable; they end suddenly; and they retrace more than the entire move — measured on daily closes, the post-peak decline gave back 156% of the 1999–2000 Nasdaq-100 melt-up’s gain, 284% of the Nikkei’s 1989 run, and 202% of the mid-to-late-2021 Nasdaq-100 leg. The entry is easy; the exit is the entire problem.
The house answer is mechanical: a melt-up is the best trend-following regime in existence, so trend systems take their signals per rules, with trailing exits and no discretionary hero-sizing — the thesis earns no extra leverage. You cannot call the top; you can only follow the middle up and let a stop take you out. How much of the middle? Measured across the three data-available canonical melt-ups (Nasdaq-100 Oct 1999–Mar 2000, Nikkei 1989, Nasdaq-100 Jun–Nov 2021; FRED daily closes), simple trailing stops at 10–15% widths captured roughly 40–70% of the melt-up’s gain — the best case (a 15% trail through NDX 1999–2000) kept 69%, while tight stops sometimes whipsawed out on mid-boom shakeouts and wide stops donated the top back (a 20% trail on the 2021 leg exited below entry). The dispersion is the honest finding: mechanical exits are not optimal and are not meant to be. Their case rests on the other measured number — in all three episodes the subsequent decline retraced more than 100% of the entire melt-up gain, so the alternative to an imperfect exit was surrendering the move and then some.
One reconciliation worth stating plainly, because it dissolves a false argument: “melt-up” and “last gasp” are the same animal viewed from different ends. A melt-up is the market’s last gasp — the terminal acceleration before the regime breaks. The two camps (the euphoric and the doomed) are describing one configuration; the only actual disagreement is whether you monetize the middle of it mechanically or stand aside moralizing at it. This paper’s answer is the former, with the exit delegated entirely to rules.
The tells (the spiral checklist)#
The regime detector is a checklist of simultaneous tells that distinguish rotation (money moving between sectors; survivable, often profitable) from liquidation (everything sold for cash; the regime break):
| Tell | Rotation reading | Liquidation reading |
|---|---|---|
| S&P + Dow together | Dow green while Nasdaq corrects | Both breaking hard |
| Credit spreads (HY/IG) | Stable | Gapping wider |
| AI-complex CDS (NVDA, ORCL) (added Aug 2026) | Grinding wider on SPV hedging | Accelerating wider as AI equity breaks |
| USD/JPY | Stable | Ripping through the intervention range, or violent yen strength |
| China crude imports | Suppressed (May trough ~6.4M bpd; July ~8.5M, reserve-fed) | Sustained restocking — imports back toward ≥11M bpd for 2+ months (customs monthly; tanker-tracking weekly confirm) into depleted Western stocks |
| Federal capital and AI | None — backstop asked and refused (Nov 2025); regulatory relief only (SEC ABS carve-out) | Any federal equity, guarantee, or CHIPS/DPA-style capital reaching an AI lab, neocloud, or datacenter operator; if it arrives distressed rather than expansionary, the socialization of losses has begun |
| Auction quality | Normal internals | Tails on US/JGB duration auctions |
| Margin channel | Single-name volatility | Correlated afternoon selloffs, ETF volume spikes |
Any two firing simultaneously flips the posture from Branch B rules to Branch A playbook. The checklist was live-fire tested in late July 2026: a KOSPI collapse measured here from index data and corrected from this paper’s own earlier understatement — −21% in the worst week, −34% in the worst month, −38.6% peak-to-trough (June 22–July 30) — with back-to-back circuit breakers, a China memory-sector shock, a BOJ meeting, and a yen intervention all failed to produce two simultaneous US tells — and the “contained rotation” read proved correct within days. The framework’s value is precisely that it kept a violent week from being traded as an apocalypse.
The checklist gained its first flow-level datum in early August (Citadel Securities platform data, August 2026): retail returned as a net buyer after selling into end-June, household passive allocation is running $1.6T of YTD inflows ($7.5B/day) with July’s ~$350B the largest monthly total on record, and August 4 was the most active day for SPX calls ever recorded. The wrinkle matters more than the headline: retail came back hedged — average daily net put premium ~$29M, roughly eight times the one-year norm. Participation without conviction is a mid-melt-up signature, not a terminal one; the canonical final-phase retail (late 1999, 2021) bought naked. The refinement this adds to the tells: watch for that put premium collapsing while inflows continue — the conviction flip is the tell, not the arrival. The same signature holds at the asset-allocation layer, with a government data series attached: money market funds hold $7.93 trillion (ICI weekly, August 12 — retail $3.10T, both still climbing), just off May’s record ~$8.3T “dash for cash”; bond ETFs took $300 billion in the first half — 29% of all ETF flows against 16% of assets — concentrated in ultra-short paper, intermediate corporates and TIPS (the largest TIPS ETF’s 30-day SEC yield: 6.18% — inflation accrual doing the yielding), while the classic safety asset stands abandoned in the household’s own experience: 20+ year Treasuries have returned −6.7% annualized for five years, so the safety bid crowds into the front end and inflation protection. Bulls read the $7.9 trillion as dry powder; in this configuration it is the hedge leg of the same trade — the crowd holds record equity exposure and record cash simultaneously, hedged participation at portfolio scale. And retail refusing duration while loading inflation protection is the duration strike in household form — the same verdict the tailing 30-year auctions deliver institutionally, arriving from the bottom of the market. And the pattern completes at the statutory layer: every new buyer the system is minting is a front-end-only buyer. The GENIUS Act (July 2025) requires every regulated stablecoin to hold its reserves in cash or short-term Treasuries — roughly $300 billion of bills now sits behind the stablecoin complex, with the largest issuer alone a sovereign-class holder of over $100 billion — a buyer created by statute, barred by the same statute from paying its holders interest, and structurally incapable of owning duration. (Tokyo is minting the same buyer: Japan’s leading yen stablecoin has committed 80% of issuance proceeds to JGBs, with the megabanks building stablecoin-settled JGB repo behind it.) Stack the layers: bills by statute, money funds by mandate at $7.93 trillion, households by preference after the long bond’s five-year betrayal — and no new buyer anywhere for the long end. The duration strike is not a shortage of dollars; it is a shortage of willingness to hold time — and Washington’s newest debt-demand machinery, whatever its other merits, manufactures only the willingness it already had. The conviction-flip tell therefore gains a second gauge, observable weekly in a primary series: money-fund assets falling while equity inflows continue. A specimen of how that flip gets manufactured surfaced the same week, and it is filed as a specimen rather than a source: a mid-sized retail investing channel’s weekly lesson taught subscribers to treat “overextension to the downside” — an RSI or Bollinger reading, packaged into a proprietary red-light/green-light meter behind a subscription — as the systematic signal to dollar-cost-average into dips, and the names used to illustrate the fear worth overriding were Micron and SanDisk: the two most faith-priced tickers in this paper’s storage-tier screen — one having ridden nearly +700% in a year to a $1.1 trillion capitalization (correction of record at the freeze: the “~128x peak earnings” this passage once carried is retired — earnings caught up, trailing ~22x — so the multiple is no longer the tell; the size is, and a forward multiple under 7x is the market’s own confession that it prices these as peak earnings), the other negative on every trailing fundamental line at a $244B capitalization. (Correction of record, added at the freeze: SanDisk’s subsequent earnings disclosed a $93.9 billion contract book — from just eight customers — so the market is pricing contracts, not pure faith. Precision cuts both ways, and then it cuts back: a supplier whose entire justification is a contract book concentrated in eight counterparties has not escaped the one-trade structure of Part III — it has become a derivative of it. The eight buyers are the leveraged spenders whose own financing is this paper’s Part IV; if the credit clock strikes them, the contract book is the transmission line. And the shortage is now policy-entangled: memory is scarce enough that Apple tested Chinese chips, and the Commerce Secretary publicly drew a red line against it — a warning with no formal rule beneath it, which is its own kind of exhibit.) The lesson is not wrong about mean reversion in general; it is the delivery mechanism by which hedged participation becomes naked conviction — the dip-buying reflex, sold as a skill, aimed at the exact tier where the reflex is most expensive to hold. And the Q2 13Fs, filed the same week, name the counterparty. Appaloosa cut Micron 41% — selling into a +242% surge — and exited SanDisk entirely; Bridgewater reduced Micron, AMD and TSMC; Berkshire trimmed semiconductor names. The sellers were not leaving the boom: Tepper simultaneously loaded Amazon, Meta, Alphabet and TSMC — while opening $242 million of Apple puts, the hedged-participation signature at megafund scale — and Berkshire raised Alphabet 83% to a $37.8 billion third-largest position, buying $23.5 billion of stock against $3.7 billion sold. The endowments filed the same week and completed the institutional picture: Harvard’s first 13F after SpaceX’s record IPO disclosed a $2.2 billion stake — roughly half its direct public book — beside its first-ever gold and bitcoin positions ($218M combined): maximum concentration in the boom’s newest listing, hedged with the oldest reserve asset there is, which is the hedged-participation signature at endowment scale and one more step in the gold sequencing this paper tracks from officials toward everyone else. The sovereign layer filed the same week and completes the stack: Norway’s $2.34 trillion fund — the world’s largest, reporting a record $184.3 billion first-half profit driven by Asian technology — disclosed its first-ever SpaceX position, $1.22 billion, deliberately sized at 0.05%, purchased into the boom’s newest listing after its round-trip. Read the three tiers together: retail was forced in by rulebook, the endowment went in concentrated, and the sovereign went in measured — the same asset, held three different ways, is a cross-section of exactly who bears the boom’s price discovery and on what terms. The shape is rotation within the complex: out of the cyclical memory tier and into the platform layer’s cash flows, hedged. Put the two files side by side — the 13Fs and the dip-buying curriculum — and the marginal-buyer question answers itself: the tier the megafunds spent the quarter leaving is the tier retail is being taught to catch. The options market shows the same signature at the microstructure layer, with a date attached. Per dealer-positioning work (Reading the Markets, mid-August): single-stock implied volatility has been crushed — the share of large names near their one-year IV highs collapsed from ~60% to ~6% in a month, with skew at one-year lows in a fifth of names, meaning call-chasing with no put demand in the single names — while the S&P’s index-level put skew rose four of five sessions: naked upside in the names, hedges at the index. That is the Citadel hedged-participation signature restated in Greeks. Meanwhile implied dispersion has unwound hard while realized has not, implied correlations are only beginning to rise — the trade class implicated in Jane Street’s July — and the whole configuration has been pinned by long dealer gamma that mechanically buys dips and sells rips. The date: that gamma largely expires at VIX expiration August 19 and monthly options expiration August 21, un-pinning the tape days before the August 26–30 disclosure gauntlet. The market’s shock absorbers are scheduled to come off the car the same week the road gets interesting. And the road itself changed surface the Monday before: on August 17, Cboe’s SEC-approved extended trading hours go live — single-stock options on roughly twenty names trading 7:30–9:25 a.m. ET, and the anticipated list is this paper’s cast (NVIDIA, Oracle, Micron, Intel, Palantir among them) — so for the first time, options on these exact names price live through the 8:30 data window: the August 26 PCE prints into an open NVIDIA options market, and morning-after earnings reactions get real-time dealer hedging in pre-market liquidity that has never carried it. New venue, thin book, maximum-news week, gamma un-pinned — the paper notes the configuration, not the direction. This paper predicts nothing about the direction of the resulting move; it notes, per the season’s habit, that the capacity for one is on the calendar. One adjacent flow datum completes the picture of a mania that is narrative-concentrated rather than universal: while equities melted up, the prior cycle’s reflexive vehicle ran in reverse — Bitcoin roughly halved from its late-2025 peak, and the largest levered BTC-treasury structure sold $105M of bitcoin below cost to service preferred dividends (August), its “not one satoshi” pledge retired by arithmetic. The crowd is not euphoric about everything; it is euphoric about one thing. And by mid-August the equity tape had sharpened even that: the Magnificent Seven were having a widely-chronicled “dreadful year” — most negative year-to-date, roughly $2 trillion of combined value shed, Apple worst — while the indexes they dominate sat at record highs, because the gains had migrated to the layer beneath them: semiconductors, memory, power, refining. Read precisely, the one thing the crowd is euphoric about is no longer Big Tech; it is Big Tech’s supply chain — the market has repriced the capex boom’s vendors while marking down its spenders, whose free cash flow went negative funding the very orders the vendors are re-rating on. That is the configuration this paper’s credit leg predicts ages worst: the customers lag, the suppliers soar, and the suppliers’ valuations assume the lagging customers never blink. (The index provider’s own data agrees on the mechanics while disputing the mood: over 60% of S&P members beat the index in both June and July and equal-weight beat cap-weight — breadth widening into the rotation, which reads to the bulls as healthy broadening and to this paper as the crowd distributing its concentration one layer down. Both readings are carried; the tell that separates them is whether the suppliers’ multiples survive their customers’ next capex guidance.) The same note supplies a headline-vs-footnote trap this paper exists to catch: ”>$1 trillion of announced buyback authorizations, the largest on record” is true and is not a corporate bid — the cash-flow statements (Part III) show the four biggest AI spenders executing near zero, with the authorizations concentrated in the two names outside the capex race. Authorized is not repurchased.
Part II — The Money: fiscal dominance and the machinery of “dare not tighten”#
The claim#
Fiscal dominance (claim file 0004): the FOMC’s policy path is better predicted by Treasury financing arithmetic than by its dual mandate. If true, the Fed cannot tighten into sticky inflation without financing costs “exploding” (TS Lombard’s phrasing) through a structure where roughly a quarter of federal debt reprices almost immediately via the bill stack.
The observed machinery, August 2026#
- The rollover treadmill: ~$6T of debt rolled per quarter (gross issuance including bill churn — a liquidity-treadmill measure, not net borrowing) against what the IMF’s April 2026 Fiscal Monitor calls deficits “unprecedented in peacetime” (6.8% of GDP in 2025, projected 7–8% through 2031), gross debt 124% of GDP rising to ~142% by 2031, and interest costs at 4.3% of GDP approaching 5% — net interest ~$1T/year, now exceeding defense. (Level check, primary, as this revision closed: total public debt outstanding stood at $39.914T on Aug 12, 2026 — Treasury debt-to-the-penny — with the $40T milestone days away; commentary already claiming it crossed is early, which is its own small datum on how the number is being consumed.) The gross-financing-needs ratio reconstructs independently from the security-level maturity ladder (Treasury MSPD, July 2026): $10.48T of marketable debt matures within twelve months — $6.99T of bills plus $3.49T of notes, bonds, TIPS and FRNs — plus a ~$2.1T deficit ≈ $12.55T against ~$29.5T GDP: 42.5% of GDP, corroborating the ~45% figure circulating from IMF data (26% in 2010). A number that size means the Treasury’s financing is a flow problem, not a stock problem: the stack must be re-sold to someone every few months, forever, at whatever price demand sets. And one property of the arithmetic deserves its own sentence: these are FULL-EMPLOYMENT numbers — a peacetime-record deficit run with unemployment near 4%, the counter-cyclical engine running procyclically, automatic stabilizers untriggered. The 42.5% GFN figure is therefore the good case: when unemployment eventually rises, the deficit does not drift wider, it lurches — which is precisely when the K-bottom data of Part VI says the claims will arrive.
- Bill-heavy issuance: the August refunding froze coupon sizes while deepening reliance on short-term bills — deferring duration cost, maximizing rate sensitivity. The 2026 Treasury’s version of an adjustable-rate mortgage. The August refunding trio completed on the 13th with the price of that deferral printed at the long end: the $25B 30-year sold at a high yield of 5.216% — the highest 30-year auction yield since 2001 — no tail against the ~5.24% pre-auction talk and a 2.39 bid-to-cover in line with recent months, but the trio’s weakest internals (dealer takedown 11.5%, indirects 66.8%, against the 10-year’s 8.6% and 76.7% a day earlier). Logged both ways, per the claim-0004 kill conditions: demand for US duration exists — at a quarter-century-high price. The auctions are not failing; the deferral is being invoiced. (A competing mechanical explanation of that invoice — under which it is not fiscal at all — is carried at full prominence below.)
- The marginal buyer problem: stable foreign official demand has dried up at the margin; hedge funds — many at extreme repo leverage — have doubled their share of Treasury purchases to ~9%. The BIS and IMF have both flagged this structure; it amplified the March 2020 near-meltdown at half today’s size. And the household side of the ledger now shows the same preference in the same week the 30-year cleared at a quarter-century-high yield: money-market fund assets at $7.7 trillion, ultra-short bond ETFs taking $12.8 billion in July alone, advisors on the record raising model-portfolio cash from ~2% to 5%, and the trailing scar that explains the behavior — the flagship 20+ year Treasury ETF has averaged −6.7% a year for five years (CNBC/flow data, Aug 15). Bond ETFs took $300 billion in the first half, but the money is crowding the front end and the TIPS sleeve, not the long end. Call it what it is: a private-sector duration strike that mirrors the Treasury’s own bill-heavy issuance — the borrower and its retail lenders both refusing the same maturity. Honest scoring note: this datum feeds both readings of the long end above — front-end preference is what a curve-mechanics world expects while cuts are pending, and duration aversion is what a term-premium world expects while deficits compound — so it joins the record as shared evidence, not as a point for our side. And the largest foreign lender is now pulling homeward by policy: in July Japan’s finance minister publicly urged the GPIF — the world’s largest pension fund, ~$1.8 trillion, heavy in US bonds and equities — to shift allocation toward domestic assets, and the yen jumped on the words alone; Japanese insurers have flipped to their heaviest JGB buying in years. Note what distinguishes this from every prior episode in the carry trade’s history: in 1998, 2008, 2020 and August 2024, a strong yen was an accident — the symptom of a crisis unwinding. This time a stronger yen is the stated goal, pursued with intervention, rate policy, pension suasion and tax design simultaneously. Repatriation by design, aimed at the marginal bid under the US long end, is a different animal from repatriation by panic — slower, politer, and much harder to reverse. (The tax lever is verified too: Japan’s lower house advanced the reclassification cutting crypto taxation from 55% to 20% for assets on regulated domestic venues — a carrot on the same string.) And the other great official pool is redirecting too, in the other direction: China’s central bank has now bought gold for 21 consecutive months — 19.9 tonnes in July alone, its largest monthly purchase since 2023 — with the pace accelerating month after month into gold’s decline from its peak (PBoC data via Caixin/China Daily), while reportedly repatriating stored bullion and its commercial banks imported metal at an accelerating rate all half. The sequence deserves note: officials first, banks second, and only then — at the bottom — did Chinese banks begin discounting retail gold-accumulation accounts against a multi-trillion-dollar household savings pool. Read beside the Japan cluster, the shape is one trade from two directions: the two largest foreign official pools in the Treasury market are simultaneously being called home (Tokyo, by policy) and redirected into bullion (Beijing, by accumulation) — the marginal-bid question of this section, answered by its two most important marginal bidders. The roster is growing: the Bank of Korea resumed gold purchases in August after a thirteen-year pause — physical, with plans to vault domestically (Central Banking, Seoul Economic Daily) — a US-allied reserve manager joining the rotation, not an adversary. And one reading circulating in the metals community deserves recording as interpretation, because the mechanism is coherent even if the intent is unproven: the yen operation itself may be the accelerant — by publicly organizing to keep Japan in its Treasury position, Washington demonstrated to every reserve manager that a UST holding of size is now effectively exit-managed, and bullion is the one reserve asset nobody can tell you when to sell. If that lesson is being learned, the FIMA valve relieves pressure on this quarter’s auctions by adding it to every future one. The tape shows the same question being asked from inside the market: since mid-July gold, silver, oil and the 10-year yield have risen together — a configuration decades of rate logic says should not persist — and per this paper’s own discipline it carries two readings that only time discriminates: the regime reading (the safe asset itself being repriced — the Du result appearing in the tape) and the mundane one (inflation lifting yields, with gold’s pain merely deferred). Both are logged; the real-rate-versus-gold tell in claim 0004’s kill conditions is the instrument that will decide. The same season supplied the counterparty reading in one issuer: SoftBank — the AI era’s most leveraged financier, ~$65 billion committed to OpenAI — spent 2026 paying a rising series of record coupons to fund it: a record 8.5% on part of a $3.6 billion April sale, then the year’s highest yen coupons again in June and again in July, with roughly $64 billion of retail bonds outstanding and a further $60 billion sought. When the boom’s chief financier pays record and rising prices to borrow from the world’s most patient savers, in the same quarter those savers’ government begins calling the money home, both ends of the world’s cheapest funding chain are tightening at once.
- The intervention tell: in early August the US Treasury joined Japan’s yen defense by activating the FIMA repo facility (letting Japan pawn Treasuries for dollars instead of selling them) and by selling US euro reserves without informing the ECB — currency-war choreography, not routine smoothing, and the EU’s irritation went on the record. Whatever else that was, it was a system managing its own fragility in public — and, notably, the FIMA mechanism is a genuine pressure-release valve: it lets the largest foreign holder defend its currency without adding to auction supply. The limits are equally instructive: within a week USD/JPY was drifting back toward the intervention range. Interventions rent time; they do not change the carry math — and by mid-August the record was quantified: the April–May solo operation was the largest in history (¥11.73T, ~$73B, nearly double any predecessor) and failed within six weeks; the historic joint operation had retraced two-thirds of its effect within two weeks (USD/JPY back to ~159 by Aug 12), with the carry remaining profitable at a 250–275bp differential even through the rate hike markets expect from the Bank of Japan in October. Two escalation markers were added to the record in the same week. First, the Treasury Secretary publicly pressured the Fed to enlarge the valve: the FIMA facility caps any single counterparty at $60 billion, and Bessent — in a Sunday post on X — wrote “The FIMA Repo Facility is an important backstop. We would encourage it to be upsized in the coming months,” adding on CNBC that the 2020 cap predates today’s bond market. The Fed declined to comment; analysts noted the ask cuts directly against the Warsh Fed’s stated goal of shrinking its market footprint, and Evercore warned that upsizing “invites markets to test the commitment.” A Treasury Secretary publicly lobbying the central bank to expand a backstop for the largest foreign holder of Treasuries is claim 0004’s FIMA-recurrence condition beginning to fill in — fiscal dominance conducted over social media, four days after the chair said “play the ball, not the referee.” Second, the positioning on the other side: CFTC data show gross yen-short exposure among large speculators and managed funds at record highs, defying the intervention through early August — the crowd is levered against the defense, which is simultaneously why the carry persists and why any snap would be violent. The operation’s mechanics, as they surfaced through August, sharpen the choreography reading: the Treasury’s side was executed by the New York Fed through Goldman Sachs and Morgan Stanley by selling euros from the Exchange Stabilization Fund — reportedly held largely in French government debt, which would mean the US supported the yen by selling French bonds without telling Paris or Frankfurt (the ECB’s fury is on the record; the IMF’s own intervention handbook advises against operating in currencies not your own); the official accounting of the operation belongs to the Treasury’s quarterly FX report covering July–September — historically published around November; this paper previously carried an August 30 date for that disclosure, which was wrong, and the correction is recorded in the changelog. (The Apr–Jun report, released August 13, formally shows no intervention — the July operation sits just past its edge.) The season’s texture deserves one line of record: the Treasury Secretary’s notepad, photographed at Camp David, read “to do: buy Japanese yen (JPY), $5–10B” — and the same Treasury’s July FX report keeps Japan on its ten-country currency-practices monitoring list, so the United States spent early August simultaneously monitoring Japan’s interventions and funding them. Peterson’s Obstfeld named the configuration “cakeism” — a weaker dollar without inflation, low borrowing costs with record deficits, Japan buying the bonds while America strengthens the yen its own tariffs and trade-deal dollar flows are helping to sink. This paper’s term for the same observation is claim 0004. The 162 line is on the spiral checklist for exactly that reason — armed, not yet fired — and the freeze week moved the ground beneath it in both directions at once: the yen posted its biggest weekly loss in three months (≈159.3) as July’s ~$87 billion of intervention effect faded, spec positioning is un-crowded (CFTC gross yen shorts at the 52nd percentile, twelve consecutive weeks of covering — whatever fires the line next, it will not be a positioning squeeze), and Reuters reported the BoJ set to hike as soon as September, now ~76% priced versus 24% at end-July. A BoJ hike closes the differential and relieves the line; a faded intervention without one walks the tape back toward it. Held, either way, with the humility the tell’s own history demands: versions of “the BoJ is trapped” have been early for a decade, which is exactly why this paper trades the checklist, not the thesis.
- The committee: a July hold at 3.50–3.75% carried three dissents — toward hiking — while the chair’s reported framework (“AI is deflationary and overrides the Phillips curve”) reads to skeptics as a pretext for accommodation. The July 29 press conference put the machinery on the record in the chair’s own words: “While at some level, we haven’t done much in 42 days, the markets have done quite a bit” — and, on ending forward guidance, “market participants are learning to play the ball, not the referee.” Read plainly: a chair who lacked the votes to hike (seven needed; three dissents the other way) reframing the long end’s selloff as delegated tightening. The bond market took the delegation literally — the 30-year rose 12bp to 5.21% during the remarks, the highest since 2007, two weeks before the August auction printed 5.216% — and the internals beneath that print carry the buyer story: bid-to-cover 2.39, the third consecutive decline (2.66 in February, 2.44 in July), with indirect bidders taking ~66.8% (a category that includes but does not cleanly measure foreign demand, stated per house discipline). The same day, the 30-year real constant-maturity yield printed 2.97% — after inflation, long lenders now earn nearly three percent for holding time, which is the valuation cushion under a record-high equity market being repriced from beneath: every point of real yield is a point of equity risk premium the melt-up no longer collects. A central bank pointing at the bond market and calling it policy is the “dare not tighten” configuration described in this Part, autographed. And in the freeze’s final week the delegation was repudiated by its own instrument: since the July 29 hold the S&P rose nearly 7%, the VIX fell six points to yearly lows, junk borrowing costs fell, and Bloomberg’s financial-conditions gauge printed its easiest level since 1996 — a thirty-year extreme (Aug 13–14) — so the “quite a bit” of market-delivered tightening the chair claimed has been unwound to beyond zero in eighteen days. A committee whose stated policy instrument is the market’s own restraint now arrives at Jackson Hole with that instrument reading maximal ease. Both readings carried: the bulls’ version is that the market has correctly called the bluff of a chair without the votes, and easing conditions are the soft landing arriving; this paper’s version is that delegated tightening has failed audibly, which forces the chair to either reclaim the referee’s whistle in his own voice on August 28 — or formally license the melt-up branch. Either way, the speech stopped being optional. July CPI: 3.4% at the headline with core at 2.5% — the slowest since March 2021 — an inversion (headline above core) that says the inflation problem is increasingly the energy tape, which is to say the fuse. The honest statement of this Part’s claim follows from that: the boxed-in Fed is conditional on the fuse burning — if the strait reopens and the tanks refill, core at 2.5% hands the committee its exit, and the bulls are right about September. The paper stakes the box on the gauge, not on the headline. Meanwhile an oil shock (Hormuz, Brent touching $90) sits queued for the August print — and the distillate tape sharpens the queue: diesel futures are up ~86% year-over-year against WTI’s ~29% (house pull, Aug 14), the fuel that moves food and freight diverging hard from the crude headline; refining-crack pass-through reaches the CPI’s food and transportation lines on a lag. And beneath the price tape runs a fuse the melt-up is not pricing at all: the strait has now been closed or contested for roughly twenty-four weeks, and the world has been paying for the calm out of storage. (Precision on “closed”: a brief April reopening lasted a day, and escorted, transponder-dark flows continue — Gulf loadings ran about 12 million barrels a day per the IEA against 20 million before the crisis, and Washington claims more. The strait is not sealed; it is rationed. The fuse mechanics need only the deficit, and the deficit is measured, weekly, in the tanks.) The US Strategic Petroleum Reserve sits at 298.7 million barrels (week ending August 7, reported August 12) — its lowest level in over 43 years, and below 300 million for the first time since 1983 — down roughly 114 million barrels since the February 28 closure; commercial crude ran ten consecutive weekly draws before posting two builds in early August (+19.9 million barrels to 424.4M, still ~2% below the five-year average) — a build fed partly by SPR transfers and an import surge to 7.3 million barrels a day, which is to say by draining the national buffer and the world’s spare cargoes to refill the commercial one; the IEA describes OECD cover in “weeks, not months,” and its August ledger has global observed inventories falling 69 million barrels in July to just under 7.9 billion — the lowest since April 2025; Europe’s middle-distillate stocks sit below their 23-day comfort line. The counter-mechanics are real and running, and the honest ledger carries them: world demand is now forecast to fall 1.6 million barrels a day in 2026 (IEA) — demand destruction doing the rationing — while OPEC+ added 1.57 million barrels a day in July alone with Saudi headroom remaining, and energy CPI fell month-over-month twice running. The fuse thesis does not require these mechanisms to fail; it requires only that the net still drains storage — and the July ledger says it does. The calm is being purchased, on schedule, out of the tanks. Precision about the calm requires naming both buffers that bought it. The first is the coordinated release: the IEA’s largest emergency stock release in its history — 400 million barrels, ordered in March — with roughly a billion emergency barrels remaining by its July accounting. The second is stranger and more strategic: China, the world’s largest importer, voluntarily withdrew from the market — imports collapsed roughly 44% from ~11.4 million barrels a day in February to a May trough near 6.4 million, the lowest since 2016, before rebounding to ~8.5 million in July (+22% month-over-month, customs data) with Chinese crude stocks still drawing per the IEA — living instead off a reserve on the order of a billion barrels it spent years filling with discounted sanctioned crude, settled increasingly in yuan outside the dollar system. The withdrawal is why the price never found the panic bid; it is also a policy variable, not a market fact. (Honesty requires the second reading beside it: part of the withdrawal is not policy but symptom. July’s bank-lending data posted a record contraction in new yuan loans — the second contraction of 2026 — on failing credit demand, the non-manufacturing PMI sits near its series lows, and Beijing is scraping offshore wealth for revenue — a sweeping tax clampdown on offshore trusts that left the country’s rich, per the reporting, “in shock.” An economy in that condition burns less oil on its own. The two readings pull the tell in opposite directions — a policy withdrawal reverses by decision and the restocking fires the row; a demand withdrawal slows the reserve draw, stretches the resumption arithmetic, and is the reading in which the tell runs late — and both are carried. What survives either way: restocking marks the policy reversing or the economy recovering, and in both cases the largest marginal buyer returns to a depleted market. And the domestic bust bounds the standoff from Beijing’s side too — a government running record credit contractions and hunting its own diaspora’s assets for local-government revenue is not a hand that holds the withdrawal position indefinitely, which is one more clock in the mutual-expiry stack of the mitigant above.) When Beijing chooses to restock, the largest marginal buyer on earth re-enters a market whose Western tanks sit at multi-decade lows — the safety net that can be removed by decision, on a schedule set in the capital of the same state whose central bank is accumulating gold against the reserve system (above). One actor now modulates the marginal barrel, the marginal Treasury bid, and the marginal ounce. The fuse’s burn rate, it turns out, has an owner. And because the owner’s return is observable and bounded — a ~1.2-billion-barrel reserve substituting ~2.5–3 million barrels a day cannot fund the withdrawal much past a year, so resumption is a when set by arithmetic — the restocking bid joins the spiral checklist as a named tell: Chinese imports sustained back toward their old pace, read monthly from customs and weekly from tanker counts, is the fuse’s ignition wire, and it is the one tell on the checklist whose trigger is guaranteed by physics to arrive eventually — with the caveat the demand reading above imposes: the arithmetic assumes consumption holds, and a deepening domestic bust stretches the clock. The only question the checklist cannot answer is whether Western stocks will have been rebuilt first — which is precisely what the Wednesday gauge measures. Brent in the upper $80s is therefore not evidence the shock is small; it is the price of the drawdown — the shock is being amortized out of inventories, and an amortized shock ends when the inventory does. And no restart date exists: as of mid-August the diplomatic state is messages-through-mediators that Tehran itself insists “do not constitute negotiations,” a third UAE tanker attacked inside a week, a second carrier group rotating in — escalation on the water while the fuse burns. The transmission speed and the political tolerance are both already on the record, dated: retail gasoline crossed $4 nationally within roughly a month of the closure — the fastest monthly increase GasBuddy had ever recorded, with diesel’s spike larger still — and as early as April the Journal reported the White House willing to end the campaign without reopening the strait. The closure, in other words, has been policy-tolerated for months; whatever the midterm incentive now argues, it argues against a standing precedent of living with it. A “peace” that leaves Hormuz closed does not touch the fuse at all — only flow does. (Freeze-weekend state, both directions dated August 15: attacks still mounting — two ADNOC vessels struck Thursday, another Friday, a projectile hit a bulk carrier Saturday, sixty-five confirmed incidents and seventeen seafarers killed since February — and the rhetoric escalating with them: the President vowing to declare Hormuz “a territory of the United States… pretty soon” and saying he does not prioritize ending the conflict before the midterms, the Treasury calling the blockade sustainable “indefinitely,” Tehran answering that the strait “will remain Iranian.” Meanwhile the one live diplomatic track produced something concrete: Iran and Oman agreed a “shipping map” governing strait traffic — which Iran’s foreign minister immediately called “a separate issue” from reopening. A map for the traffic, no date for the door. Unresolved, and logged as such.)
Honesty about the asymmetry, before the fuse gets over-read: the United States is the world’s largest crude producer — a record ~13.8 million barrels a day forecast for 2026, per the EIA’s August STEO — and a net exporter of petroleum. The precision matters, because a knowledgeable reader will press on it: petroleum, not crude. The US still imports roughly 6 million barrels of crude a day while exporting over 3 million, because the barrels don’t match — shale yields light sweet crude while the refinery slate was built for heavy and medium sour, so America exports the grade it produces and imports the grade its refineries want. But trace the imported barrel to its origin and the Hormuz exposure nearly vanishes: Canada supplies about 60% of US crude imports — heavy, by pipeline, no strait involved — Mexico another tenth, while the Middle East Gulf supplied roughly 490,000 bpd in 2025, about 8% of imports and some 2–3% of refinery runs, most of it medium sour and concentrated on the pipeline-poor West Coast (Iraq, Saudi Arabia, the UAE). A closed Hormuz is therefore a regional refinery-slate problem and a crack-spread problem — diesel yields, the pass-through the K’s bottom leg feels — not a national feedstock crisis. Hormuz threatens America through price, not volume. The physical-shortage risk belongs to Japan, Europe, India and China; US producers are, bluntly, beneficiaries. That asymmetry explains what otherwise reads as inexplicable — the April tolerance precedent above: a closed strait is politically survivable for a producer nation whose pain is distributional (pump prices, diesel pass-through, the K’s bottom leg) rather than physical. And it bounds the “adversaries hold all the cards” reading this season invites: Iran’s closure strangles its own export revenue — Washington now openly aims at the economy the strait was meant to shield, and Tehran’s one live negotiation track, through Oman, is precisely about maritime passage; Beijing’s withdrawal is finite by arithmetic; Moscow alone unambiguously gains. The leverage inversion is real, but it is mutual and expiring on several clocks at once — nobody in this standoff can hold the position indefinitely, which is exactly why the inventory gauge, and not the rhetoric of any capital, is the thing to watch. The one dated de-escalation force anyone can point to is political arithmetic: US midterms on November 3 give the administration roughly eleven weeks of incentive to calm the oil price, and prediction markets have begun pricing the Senate flipping. Whether that incentive can reopen a strait is exactly the kind of question this paper declines to predict and the inventory gauge will answer regardless. Credit here goes where due: the heterodox economist Steve Keen has been arguing that this crisis class is categorically different from 1987, 2000 or 2008 — not credit overreach inflating an asset, but destroyed productive capacity colliding with debt service that was sized in the old world (firms and households current on their obligations for fifteen years suddenly short the income, not the discipline; force majeure disputes passing the loss to bank equity). His specific depletion percentages for fertilizer, helium and lubricants are his estimates and are not adopted here; his mechanism is adopted, because the EIA’s own tank gauges are currently acting it out. For claim 0004 the implication is direct and grim: a Fed that dare not tighten into 3.4% inflation now faces the prospect of a storage-exhaustion price spike arriving into a labor market already shedding jobs — the exact configuration in which neither hiking nor cutting is an answer, which is to say the configuration this paper’s melt-up branch was always racing against. The bet remains a race between two clocks; what this adds is the inventory fuse burning beneath both — it decides nothing on its own, but when it reaches the tank floor it forces the credit clock forward — and it is the only element in this paper’s system with a literal gauge on it, arriving roughly when the 36%-imputed index faces its September stress test. July PPI (Aug 13) sharpened the underneath: headline 0.0% m/m only because energy fell 3.1%, while core ex-food/energy/trade ran +0.4% m/m and 4.7% y/y — pipeline inflation hotter than CPI, with two of this paper’s exhibits visible inside the index itself (construction +2.2%: the buildout appearing in producer prices; portfolio management fees +6.5%: the wealth-effect strut literally becoming a producer price). Markets read the week dovishly anyway — September hike odds drifted from ~48% to roughly 31% across the CPI/PPI/retail week — the tape walked the committee from coin-flip to two-to-one hold. And the freeze’s final session sharpened the divergence this paper watches most: hike odds fell on weak retail and sentiment data while the 30-year rose to 5.25% and the 10-year to 4.68% — the long end refusing the flight-to-quality script, which is the fiscal reading in miniature.
- The credit market’s verdict: while equities set records, NVDA credit default swaps hit record wides (~69bps, above Google’s) and Oracle’s hit cycle highs. Some of that is mechanical hedging of new financing structures (Part IV); the divergence is still the classic late-cycle signature — credit charging more for the boom equity is celebrating.
The counter-mechanism: curve dynamics, not vigilantes#
The strongest challenge to the fiscal reading of the long end arrived the day after the auction, from the curve-mechanics school (Eurodollar University, Aug 14), and it deserves this section because its central exhibit is checkable — so we checked it against Treasury primaries. On August 11, 2011 — S&P-downgrade week, a genuinely disastrous 30-year auction — the 3-month/30-year spread was 379 basis points on $14.59 trillion of federal debt (both numbers from Treasury’s own data; the commentator’s $14.3T was slightly low). On August 14, 2026 the same spread was 139 basis points on $39.91 trillion. The market is charging roughly 240 basis points less term compensation against $25 trillion more debt — which is the opposite of what awakened bond vigilantes would print, and no amount of narrative fits around that arithmetic. The precedents check too: the notorious November 2023 30-year auction tail was followed by a bond rally, not a buyers’ strike, and the 2011 disaster barely registers on a long-term chart. This week’s internals (logged above) point the same way: a level story, not a demand-collapse story. The mechanism offered instead: since September 2024 the curve has been normalizing out of historic inversion, and because this Fed cuts piecemeal rather than panicking — unlike 2001 and 2007–08, when aggressive front-end cuts let the 30-year drift sideways-to-lower — the pinned front end forces the steepening to escape with an upward bias at the long end. No vigilantism, no inflation signal, no deficit verdict: just a curve un-inverting around an obstruction.
Honesty about our own exhibits follows. The +12bp during the Warsh press conference does not discriminate between the readings — a Fed visibly holding up the front end is precisely what the curve-mechanics story requires, so both schools claim that datum. Nor does the September 2024 episode (a 50bp cut met by rising long yields), which mechanics calls normal steepening and the fiscal school calls the vigilante tell. What discriminates is dated and forkable, and both schools have now effectively signed their predictions: when this Fed’s next sustained cutting phase arrives, curve mechanics says the 30-year goes sideways-to-lower as the front end falls; the fiscal reading says the long end stays elevated or rises as the cuts confirm the accommodation. That fork joins the register as a live experiment with a named counterparty. One measured instrument entered the season on the fiscal side, and it deserves precise statement because it is neither narrative nor auction-reading: Du, Keerati and Schreger (“Decoupling Dollar and Treasury Privilege,” Federal Reserve IFDP / IMF Economic Review) find that the dollar’s convenience privilege remains intact while the Treasury-specific convenience premium — the discount the world once paid for the safest, most liquid asset — has eroded to roughly zero, a supply-driven decoupling measured in basis points. That is not vigilantism and it does not contradict curve mechanics; a vanished specialness premium raises the level the long end settles at, while uninversion shapes the path. The fork above tests the path; the Du result stands as the fiscal reading’s best-measured exhibit on the level, cited as such. Two boundaries keep this paper’s claim intact under either outcome: claim 0004 is about the committee’s behavior — three dissents toward hiking that could not find seven votes, no tightening into 3.4% inflation — not about the long bond’s price; and the melt-up channel of Part II runs through the front end and financing conditions either way. But the auction-as-invoice exhibit above is hereby downgraded from evidence to contested reading, and carries this counter-mechanism beside it wherever cited. One more symmetry the season keeps supplying: the same week’s Bloomberg framing (“a warning to Bessent”) and this counter-mechanism cannot both be right, and both were published within twenty-four hours of the same unremarkable auction. The tape did not change between them; only the story did. That is Part VII’s epistemics point, demonstrated on our own exhibit.
Why this feeds Branch B before it feeds Branch A#
Fiscal dominance is commonly narrated as a crash thesis. Its first-order effect is the opposite: it is the melt-up’s engine. A precision note an adversarial reader deserves: measured against CPI, US real rates today are mildly positive (bills ~3.8% vs 3.4% inflation), so the classic “negative real rates” formulation overstates the case. The operative gap is against nominal growth: cash yielding ~3.8% in an economy growing ~5% nominally is a shrinking claim on that economy, and a policy structure that cannot raise the yield without detonating its own financing keeps it shrinking. That gap — cash trailing the economy, with no credible path to it catching up — is the crack-up fuel. Gold above $4,300 with central banks buying, record money-market balances in dollar terms even as cash sits at low shares of household portfolios, and equity records on soft data are all the same phenomenon. (An honesty check the devaluation chorus omits: gold’s all-time high was ~$5,600 in January 2026, and for most of the summer the metal was a recovery leg, not a breakout. That check needs its own update as this paper closes: gold ran +11% in the first eight sessions of the yen-intervention failure — $4,034 to $4,467, front-month futures (spot ~$4,406 at the later print) — closing to within 20% of the peak, with a supply footnote worth knowing: Turkey’s central bank, a forced seller of ~$8B of bullion in March to defend the lira, finished liquidating and was rebuying by May. The distressed-seller overhang lifted precisely as the debasement bid strengthened. And the inventory pattern this paper calls the fuse is no longer oil-only: LME copper trades in deepening backwardation, the spot premium heading for its widest since the 2021 squeeze (Bloomberg, Aug 14), with US imports at a twelve-year high having pulled visible LME stocks down 14% and the price above $14,000 — a second physical market paying for its calm out of visible inventories, and a second gauge with a weekly read — and Turkey itself is the mechanism preview this paper’s Branch A implies: when the currency is the priority, the gold gets sold at whatever the price is. A scoreboard footnote first, house arithmetic: priced in yen — the currency of the most indebted major sovereign — gold has roughly 3.5x’d since 2020 (the metal’s 2.3x times the yen’s 1.5x depreciation), against roughly 2.3x in dollars and materially less in Swiss francs. Devaluation is not a forecast in that ordering; it is a ledger. Two sentiment gauges complete the check, as of mid-August: central banks were on pace for another year on the order of a thousand tonnes of purchases — the institutions that print money still swapping it for the thing that cannot be printed — while the sell side split rather than converged: JPMorgan maintained its $6,000 year-end target as Goldman cut its own, leaving a four-figure gap between major desks. For a position this paper holds as ballast, the split is the healthier reading — unanimity is what tops are made of.) The wealth-effect strut of the loop acquired a dated exhibit in mid-August: with midterms approaching, the administration was publicly weighing capital-gains cuts — indexing gains to inflation and enlarging the home-sale exemption — a proposal an earlier version of which the Committee for a Responsible Federal Budget scored at roughly $1T of added debt. A fiscal system contemplating a tax cut on asset appreciation while interest costs set records is the circuit’s outer strut made explicit: policy defending the asset prices its own revenues and politics now depend on. The crisis version of the thesis requires a trigger (a failed auction, a basis-trade accident, a political shock to Treasury credibility (the 2026 midterm certification window is on the calendar as exactly such a candidate), or a carry-trade unwind catalyzed by the Bank of Japan’s October 29–30 meeting — the first dated candidate on the list, since a hike into a failing intervention regime squeezes the trade that funds the marginal Treasury bid); until a trigger, the pressure expresses itself as levitation. Both readings are held as one pre-registered claim with ten scoreable assertions and kill conditions (Appendix B).
Part III — The Machine: what the filings say the AI buildout actually is#
The AI trade is usually argued in narratives. It can instead be read — in purchase-commitment schedules, lease footnotes, Form 4s, and counterparty filings. Three weeks of primary-source excavation produced the following, all reproducible by any individual with EDGAR access (Appendix C).
The commitments are real and accelerating#
The archetype: AMD’s Q2 2026 10-Q. Between March and June 2026, total unconditional purchase commitments rose from $25.7B to $30.3B, with the out-years exploding: 2027 commitments doubled ($2.7B → $5.5B), 2030 doubled, 2031+ went from $8M to $566M. After quarter-end, AMD signed $9.5B of additional datacenter leases (terms to 16 years) on top of $4.5B already signed-but-not-commenced. A company being squeezed out of supply does not double its 2027 unconditional commitments in thirteen weeks. The equity market sold the print on optics (“capex tripled”); the balance sheet said capacity secured, demand contracted. The same commitments-vs-optics gap repeated across the complex all season: beats sold, guides punished, while contracted out-year obligations compounded — through to the freshest instance as this paper closed: Cisco (Aug 12) beat on both lines, guided FY2027 revenue up ~14–16% with $7.5B of expected AI-related revenue, and was sold ~4% after hours anyway — the bellwether version of a market that pays for nothing already promised.
Scale the AMD archetype up and the aggregate is startling: compilations of the same footnotes across the five largest technology companies put roughly $1.65 trillion of obligations that appear on no balance sheet — a figure this paper carries, deliberately labeled, as a reported secondary compilation not yet reproduced by our own pipeline (the reproduction from the five issuers’ filings is queued as register item 9b; until it lands the number is quoted, not certified — the AMD pull above is the piece we verified ourselves, and it is directionally consistent) — leases signed but not commenced, take-or-pay purchase commitments, backstops — with single-quarter commitment additions now approaching $900B across three companies (Meta alone: $233B in new commitments in a quarter, $96B of it leases; NVIDIA: $50B of leases for one Texas datacenter). None of it is hidden and none of it is fraud — every dollar is disclosed, in footnotes, across hundreds of pages. Which raises the question this paper’s method depends on: if it is all disclosed, why is reading it worth anything? The academic answer is threefold: investors anchor on the headline number they are shown (Damodaran’s observation; Sloan 1996 showed accrual-heavy earnings disappoint and markets price them identically anyway); disclosure buried across four footnotes on page 83 enters prices only partially (Bloomfield’s incomplete-revelation hypothesis — the harder a fact is to extract, the less completely it is priced); and the professionals who do extract it cannot move the price alone, because shorting a melt-up requires staying solvent longer than the crowd stays inattentive. Camouflage, not fraud — and camouflage only works on people who are not reading.
The physical constraint is power, and everyone is racing it#
The binding scarcity is not GPUs; it is powered datacenter slots. CoreWeave ended Q2 2026 with 1.5GW of active power after adding ~500MW in the quarter — “more power in Q2 than any single neocloud operates in total today,” per the call (transcript-verified) — with contracted power at 4.2GW, a year-end target above 1.85GW active, and a stated goal of 8GW+ by 2030. The hyperscalers’ answer is generational: ~9.8GW of nuclear commitments across 13 deals — Microsoft’s 835MW Three Mile Island restart (the only deal actually under construction, 2027), Amazon’s X-energy equity and Susquehanna campus, Google’s Kairos fleet order, Meta’s 4GW TerraPower program — plus a $17.5B federal loan program behind them. Two sober footnotes: committed-vs-delivered currently reads 9.8GW paper / 0.835GW under construction / 0 delivered (a ratio we log annually as the announcement-inflation gauge), and the advanced-reactor fleet runs on HALEU fuel that essentially one US company (Centrus: 0.9 tonnes/year today, 12 tonnes/year targeted “by 2029+”) can produce — the CoWoS of nuclear (claim 0005). And power’s twin bottleneck turned out to be consent: Data Center Watch’s Q1 2026 report counts roughly $130 billion of data-center projects blocked or delayed in three months — more than 75 build-outs, opposed by bipartisan local coalitions over power prices and water — a physical-world veto the capex models carry nowhere. (A circulating “$160 billion” figure overstates the reported number; corrected per house rule.) In the paper’s final fortnight the veto acquired a statute and a price list, in the friendliest jurisdiction the buildout has: on August 3 the governor of Texas ordered a full audit of every data-center project in the ERCOT interconnection queue — site control, capital commitment, ownership, tax concessions, water sourcing — with grid access denied to projects that fail it, and interconnections paused pending the review (the queue holds ~474GW of requests against a 91GW all-time state demand record — 5.2 times everything Texas has ever consumed at once, doubled since January; of 377 operators surveyed on power and water use, 28 replied). Senate Bill 6 sets the new economics: $100,000 screening fees, $50,000/MW financial security forfeited 80% on walk-away, developers paying 100% of dedicated transmission — and the PUCT has affirmed, in its first case under the statute, curtailment authority over co-located data centers: in a grid emergency the state can switch them off, uncompensated. The industry’s answer is the workaround that converts the software business into a worse one: Stargate’s Abilene campus runs on-site gas turbines and skips the queue entirely; Amazon’s Pecos County project is fully off-grid around 35 turbines totaling 7.65GW; and a Floodlight/Texas Tribune investigation found at least 38 Texas data centers holding minor-source air permits — the category written for dry cleaners and gas stations. Software companies are becoming unregulated utility companies with utility margins and none of a utility’s social license. Nor is Texas alone: New York paused discretionary permits for hyperscale projects above 50MW for up to a year (~12GW stranded), Virginia’s regulator shifted dedicated-upgrade costs fully onto data centers after residential bills jumped 30%, industry trackers count over a hundred local pauses, and BloombergNEF puts roughly 49.8GW — nearly a fifth of the US pipeline — at risk of delay. The equipment queue hardens the wall from the other side: high-voltage transformer lead times run three to five years, and GE Vernova’s turbine backlog (116GW) is booked through 2031. And the cash-flow statements now record what the physical wall costs to climb: the six biggest builders’ combined Q2 capex of $189.2 billion — up 91% year-over-year — equaled 108% of their combined operating cash flow; Alphabet posted its first negative free-cash-flow quarter since its 2004 IPO (record $44.9B quarterly capex, full-year guidance raised to $195–205B on the same call), and Microsoft is now the only US hyperscaler still generating positive free cash flow. The group, as a group, spends more than the business makes — into a permission regime that has begun saying no.
Notably absent from the nuclear deal table: the neoclouds. CoreWeave and Nebius rent power through hosts; they cannot sign 20-year PPAs. In a power-scarce 2030s, that is a structural disadvantage hiding beneath this year’s gigawatt bragging.
The web (who is actually connected to whom)#
Full-text search across all SEC filings builds a counterparty graph no narrative can spin — every vendor, host, lender, and landlord material enough to file. For CoreWeave: Core Scientific (57 filings — the hosting backbone), Applied Digital, Galaxy Digital, Blue Owl’s net-lease vehicles on the real-estate side, and — the discovery — a private-credit lender tier (Carlyle, PIMCO, Blackstone, MSD vehicles) holding the debt stack, visible because BDCs must disclose portfolio holdings. For Nebius: a structurally different animal — no BDC tier (it self-funds from an $8B cash pile and customer prepayments), a scrappier host web (ex-bitcoin-miner pivots: IREN, Bit Digital, Soluna, WhiteFiber). The market prices the two as twins; the paper says one is a leverage story and one is a cash story. When Nebius printed 454% growth with positive adjusted EBITDA the next morning, its entire supplier web repriced ~10% pre-market within hours — the graph is not an abstraction, it is the transmission map, and Core Scientific (the only name in both neocloud webs) got paid by both tenants inside 24 hours.
The graph’s densest node acquired a measured weight this season, at the layer above the neoclouds. Microsoft closed its fiscal year with commercial RPO — booked future revenue — at $678 billion, up 84%, and its CFO disclosed the growth “excluding OpenAI” at 25%, a formulation that lets anyone with last year’s numbers derive the rest: roughly $218 billion, about a third of Microsoft’s entire backlog, traces to one private, unprofitable customer. (A circulating “45%, $280B” version overstates the derived figure; corrected here even though the overstatement flatters this paper’s argument.) The flow side is now disclosed too, and it closes the circle with numbers on both legs: Microsoft’s earnings disclosures show $24.1 billion of FY26 revenue from OpenAI — 7.26% of Microsoft’s entire $331.8B top line from one private customer, and roughly 70% of its AI business under Bloomberg’s growth extrapolation (labeled as extrapolation; the $24.1B itself is disclosed) — while OpenAI’s audited 2025 financials, viewed by Zitron’s publication and independently verified by the Financial Times, show it paid Microsoft $17.2 billion that year, against revenue of $13.07 billion and losses that grew 7.6x to $38.53 billion. Read the two disclosures together: Microsoft books $24 billion from a customer that pays it $17 billion while losing three dollars for every dollar it earns — the circular-revenue objection this paper has carried since the counterparty brief, no longer an inference, now an arithmetic of filed and audited numbers. Add Oracle, where OpenAI’s $300 billion five-year contract is roughly half the booked backlog, and something like half a trillion dollars of two hyperscalers’ capitalized future revenue rests on a single counterparty whose own financing needs are the subject of Part IV. Note also the disclosure’s shape: when a CFO starts reporting growth ex-OpenAI, the way miners once reported earnings ex-writedowns, the concentration has become material enough to need a euphemism. Steve Eisman — who sold his Google this season to cut AI exposure — compressed the structure into one sentence: “it’s all one trade… so it better succeed,” and named the monitor this paper already watches: the financial health of OpenAI and Anthropic, legible at last when the S-1s land. The short-seller who found the last cycle’s correlation-one trade and this paper’s IPO gauge are now pointing at the same documents. And the one-trade structure produced its first casualty report at the market-making layer as this paper froze: Jane Street — no losing month since 2016 — lost roughly $15 billion in July in the AI selloff (Reuters, Bloomberg, Aug 14), told employees it had “significantly reduced risk in affected strategies,” and would become “more selective.” Two details deserve the record. First, Reuters ties the hit to exposure connected to Situational Awareness — the levered AI fund founded by the author of the very essay this paper’s Part 0 answers. The capability thesis, financialized, has delivered the credit thesis its first proof of concept at the liquidity-provider layer; the two clocks are no longer racing in separate rooms. Second, the market-structure implication is worse than the loss: when the firm with the market’s best risk record de-levers a crowded trade, the liquidity beneath that trade thins at precisely the moment every other crowded holder needs it — the Jane Street note is not a casualty count, it is a change in the depth of the exit. The counter-reading earned its place within the week and is carried at full strength: the loss propagated to nothing — the Situational Awareness book was absorbed privately by Citadel, no counterparty or funding-market stress appears anywhere in the record, the firm’s year-to-date trading revenue still exceeds its record full-year 2025 haul, and days after the loss reached print the credit market handed Jane Street $14.6 billion of fresh term debt (three tranches, taken down by the largest bond managers). A $15 billion monthly loss at a top-three liquidity provider was, on the evidence to date, a stress test passed. Both readings stand: the system absorbed this one — and the absorption consumed some of the depth that would absorb the next one.
The insiders#
Form 4 sweep, June 1 – August 7, 2026, across eleven AI-hardware names (NVDA, AMD, AVGO, AMAT, MU, LRCX, KLAC, MRVL, SMCI, DELL, CRWV): 603 open-market sale transactions by 49 distinct insiders. Open-market purchases: one — a single director, 1,000 shares. Nearly all selling is 10b5-1-scheduled and individually unremarkable; the signal is not the selling, it is the total absence of buying at these prices, plus the tempo (a founder filing to sell $4B the day his company crossed $3T; a neocloud CEO selling ~$25M/week into his own print). Executives are paid in stock and diversification is rational — and still: across the entire complex, at these prices, over ten weeks, nobody with the most information used their own cash to buy. Selling tells you about diversification; the absence of buying tells you about conviction.
Widening the lens confirms the pattern is the complex’s posture, not eleven names’ quirk. Extending the same sweep to the full AI web this paper maps — roughly 55 US-filer names spanning semis, equipment, neoclouds, hosts, optics and interconnect, power and nuclear, the securitization arrangers, and the hyperscalers (June 1 – August 12, 2026) — yields approximately 3,540 open-market sale transactions by ~136 distinct insiders, against four individual open-market purchases (one director each at Broadcom and Galaxy Digital, plus an internal Blackstone fund vehicle). Dollar-weighting sharpens rather than softens it: $7.9 billion of open-market sales against $35.5 million of purchases — 222:1 — and $35.0M of that buy side is the Blackstone fund entity. Individual human beings across the entire complex bought roughly half a million dollars of stock with their own cash in ten and a half weeks, against $7.9B sold — a dollar ratio in the thousands to one (market-wide norm: single digits). The one systematic exception survives scrutiny only partially: TSMC’s executives logged 114 purchase transactions in the window — but totaling just ~$1.5M (average ~$13K, the fingerprint of share-plan accumulation, not conviction sizing), and TSMC Form 4s only begin appearing in March 2026, so no prior-year baseline exists to call it routine. Even the exception, in dollars, rounds to zero.
The corporate bid is being withdrawn too#
The insider ledger has a corporate twin, and it flipped in 2026 — verified here directly from the repurchase line of each issuer’s cash-flow statements, not from coverage. Alphabet’s buyback stair-stepped down through 2025 ($15.6B/quarter → $13.2B → $11.9B → $5.5B) and hit zero in Q1 2026 and zero again in Q2 — a full suspension, now two quarters deep, alongside its planned first equity sale in twenty years (~$85B). Meta shows three consecutive zero quarters after peaking at $12.8B, and is reportedly weighing an equity offering in the tens of billions. Amazon has not repurchased a share since mid-2022. Of the four biggest AI spenders, that leaves Microsoft as the lone buyer, at a steady ~$4.6B per quarter. Per Barclays, the six largest tech firms — who supplied over a quarter of all S&P 500 buybacks in 2024–25 — cut repurchases ~17% year-over-year while every other sector’s rose; the S&P 500 Buyback Index has lagged the broad index by ~30% since late 2022. The exceptions complete the picture, also from the filings: Apple, outside the capex race, keeps repurchasing ~$25B a quarter against its fresh $100B authorization — and NVIDIA bought back $19.3B in its April 2026 quarter, the largest in its history — the seller of the shovels buys back its stock at record pace; the buyers of the shovels have stopped buying theirs and started issuing. One objection, raised in adversarial review, resolves cleanly enough to live in the text: under this paper’s own valuation lens, issuing faith-priced stock is rational — so the tell is not that Alphabet sells; it is who buys, and at these prices the marginal buyer is the ~$7.5B-per-day passive household bid documented in Part I, arriving hedged. The two loudest counterexamples — Apple and NVIDIA repurchasing at records — are the two names outside, or selling into, the capex race; their bid confirms the pattern’s shape rather than breaking it.
The synthesis is the point. For a decade the most reliable marginal bid under mega-cap tech was the companies themselves. That bid is now being withdrawn at the AI leaders in the same season insiders decline to buy — the two best-informed bids in the market stepping away simultaneously — while the funding mix inverts from internal cash returned to shareholders into external capital raised from shareholders and creditors (equity offerings, record debt issuance, and Part IV’s SPVs). In capital-cycle terms (Chancellor’s Capital Returns) this is the classic sign flip: firms repurchase when capital is abundant relative to opportunity and issue when the buildout consumes more than the business generates. Whatever it says about AI’s promise, it mechanically converts shareholders from recipients of cash into providers of it — the definition of a capital-consuming boom — and it quietly removes one of the structural bids the melt-up tape has been leaning on. NVIDIA repurchasing its own shares while financing the SPVs that buy its product for lease to its customers, who themselves have pivoted from buybacks to issuance, is the vendor-financing circle of Part IV drawn one loop tighter.
Part IV — The Securitization Phase: the housing arc, compressed#
The event#
On August 10–11, 2026, NVIDIA assembled Apollo, Blackstone, BlackRock, Brookfield, Goldman Sachs, and KKR into dedicated pools to finance AI infrastructure: special-purpose vehicles issuing debt collateralized by compute itself, leasing capacity to NVIDIA’s customers, with NVIDIA taking up to 25% of any deal and first transactions expected within months — a $500B program. The CEO’s phrase: compute is now “an investable infrastructure asset.”
This is the thesis-defining artifact. The useful-life assumption at the heart of the AI accounting debate (Part VII; claim 0003) has been securitized: half a trillion dollars of credit paper whose collateral value depends directly on how long GPUs stay economically alive. If six-year schedules hold, the paper performs. If competitive life is closer to three years, the residual-value gap lands on the SPVs and their lenders. The depreciation argument now has levered counterparties, which cuts both ways: cheap capital extends every weak balance sheet’s runway (delaying any reckoning), while converting the eventual reckoning from an equity event into a credit event. The first SPV deal’s advance rate against GPU collateral will be the market’s actual useful-life estimate expressed as a single number — no narrative, just a haircut.
The housing arc, mapped#
Map the 1990–2008 housing market by structural stage rather than by year:
| Stage | Housing | AI (accelerated) |
|---|---|---|
| Fundamental appreciation | 1990s | 2016–2022 (research era) |
| Policy-fueled acceleration | late ’90s–2003 | 2023–2024 (the ChatGPT boom) |
| Securitization mania | 2004–2006: the CDO machine industrializes; credit standards dissolve; leverage migrates into opaque vehicles | 2025–2026: now. GPU-collateralized SPVs ≈ MBS; neocloud delayed-draw term loans at 7–15% ≈ ARMs; the BDC/private-credit web ≈ the CDO buyers; vendor/ecosystem financing at ~20x the telecom bubble’s total (reconstructed below) |
| Peak | 2006 | (projected) 2027 |
| Credit cracks | 2007 (Bear’s funds; ABX) | (projected) late 2027–early 2028 |
| Break | 2008 | (projected) 2028 |
Housing took roughly three years from securitization mania to peak. Apply the AI cycle’s observed acceleration and August 2026 plus ~18 months lands at late 2027 / early 2028 — the window this paper pre-registers (journal entry #9, Appendix D). Epistemic status, stated plainly: the compression factor is a judgment, not a fit — this is an analogy wearing a clock, pre-registered so it can be scored, not a derivation.
A scale honesty check belongs here too — and it moved under this paper’s feet during the very season it was written. Through 2025 the story was that the big four funded their capex from operating cash flow: the most profitable companies in history spending their own money, with leverage confined to the periphery (neoclouds at 7–15% coupons, vendor-financed hosts, the compute-collateralized paper). As of the Q2 2026 season that cushion is exhausted at the core: the four largest hyperscalers posted their lowest combined free cash flow in a decade (single-digit billions, headed toward ~$4B — levels last seen in 2014, when their revenues were a seventh the size), Alphabet went FCF-negative for the first time in its public life on $44.9B of single-quarter capex with 2027 guided higher, and Microsoft stands as the only US hyperscaler still generating positive free cash. The marginal buildout dollar at the core is now financed, not earned — which is also the mechanical explanation for Part III’s buyback withdrawal: FCF at zero forces the sequence this paper describes (halt repurchases → issue debt and equity → externalize the balance sheet into SPVs). The periphery-cracks-first logic stands — housing’s subprime originators failed before the prime core, and the levered neoclouds remain the canaries — but the housing mapping just tightened: the core’s fortress is now spending its moat. The window triangulates with two independent timestamps: Gartner’s own prediction that >40% of agentic AI projects cancel by end-2027, and the concentration of hyperscaler/supplier purchase commitments in 2027 — the year contracted promises must become recognized revenue or renegotiations begin. Policy pressure (Part II) supplies the “impetus”: a wealth-effect-dependent fiscal system, through a midterm cycle, will do what it can to keep the boom alive — which is precisely how manias get their final act.
The two honest tensions#
The CDS chronology is early. Housing’s credit-market warning (the ABX index) did not flash until 2006–07 — within the mania’s late stage. NVIDIA’s CDS is at record wides now, at what the map calls 2004–05. Either the credit market learned from 2008 and reprices earlier (in which case the compressed cycle may also break earlier than the map suggests), or the widening is substantially mechanical hedging of the new SPV structures. Distinguishing these is a standing watch-item; the author’s own pre-registered handicap widens the window’s error bars by ±12 months, with real weight on “earlier.”
The crash shape is probably telecom, not housing — unless it couples. Housing was consumer balance-sheet leverage transmitted through the banking core: systemic by construction. AI is corporate and private-credit leverage, which historically resolves like telecom 2001 — a brutal sector depression, survivable system. The specific telecom rhyme is worth naming, with numbers: Lucent and Nortel financed their own customers’ purchases — booking revenue against loans to CLECs that could never repay — and both were destroyed when the receivables met reality. The era’s totals: Lucent $8.1B of commitments (24% of its revenue, $3.5B ultimately written off), Nortel $3.1B, Cisco $2.4B — ~$25.6B across the nine largest suppliers at end-2000 (McKinsey). The current cycle: NVIDIA’s direct commitments alone ($110B — the $100B OpenAI letter of intent, the CoreWeave stake and $6.3B purchase backstop, xAI, Nebius) run ~67% of its revenue, nearly three times Lucent’s revenue-relative peak; add the $500B SPV program it is co-sponsoring and the ecosystem financing total is ~20x the entire telecom-era vendor-financing complex — the multiple survives primary reconstruction. NVIDIA’s ecosystem architecture (equity stakes in customers, backstop purchase commitments, and now co-investment in SPVs that buy its own product to lease to its own customers) is that pattern at an order of magnitude greater scale, with one material difference in each direction: NVIDIA’s balance sheet is a fortress Lucent’s never was, and the leverage has been pushed outward into the SPV/private-credit tier — which protects the vendor precisely by relocating the eventual loss onto the paper’s holders. The systemic scenario requires coupling: an AI credit event and the Treasury-market fragility of Part II firing together (a basis-trade unwind meeting a risk-off shock). That coupling — not either thesis alone — is the tail that justifies permanent ballast.
The collateral has a geography. Housing’s collateral was scattered across ten thousand zip codes, legally recoverable, and could not be destroyed by a foreign government’s decision. The compute now being pledged into half a trillion dollars of SPV structures is different in kind: every GPU in every collateral pool — NVIDIA’s, AMD’s, all of them — passes through TSMC’s fabs and advanced-packaging lines, overwhelmingly on one island inside a declared great-power flashpoint. A Taiwan contingency makes the collateral unreplaceable, not merely impaired — no reproduction cost exists at any price on any relevant timeline. The paradox deserves stating precisely, because it cuts both ways: an interruption would make existing fleets scarce and their near-term cash rates would likely spike (embargo economics — the vintage fleet appreciates), even as the growth story collateralizing the out-year paper dies, credit markets reprice everything AI-adjacent, and the buildout’s 2027 commitments become unfulfillable. Value up, structure down — simultaneously. This is also the honest gloss on Part III’s one insider exception: the people accumulating their own stock run the chokepoint everyone else’s collateral depends on. Watch-items added to the standing instrumentation: whether the first SPV deal documents price geographic concentration at all (a collateral package that treats a Taiwan event as force majeure has quietly told you its true advance rate), the TSM ADR premium/discount versus local shares, and Taiwan sovereign CDS as the war-risk gauge the AI complex never quotes.
The third tension, added in adversarial review: the market has read the footnotes#
This paper’s method leans on incomplete revelation — disclosed facts, buried in footnotes, entering prices only partially. A commissioned adversarial review pressed the strongest objection to that epistemology, and it deserves the same prominence as the claims it attacks: the prices that would show credit stress show none. Investment-grade spreads sit at 79bp and high-yield at 271bp (ICE BofA via FRED, Aug 12, 2026) — the tightest decile of the trailing three years, with high-yield tighter than six months earlier. Oracle, the most AI-levered investment-grade credit alive, priced $25B in February 2026 into an order book of roughly $130–155B — the largest ever recorded — and tightened in secondary afterward. The IMF (April 2026), the Bank of England (July), the Federal Reserve (May), and the FSB each examined circular AI financing this year, and each declined to certify present systemic stress: “the impact on financial stability appears modest currently,” in the IMF’s words. If the footnotes were simply unread, that would be an answer — but the buyers of the Oracle book are the most footnote-literate desks in existence. So the objection lands where it aims: a thesis that treats every disconfirming price as evidence of crowd inattention has removed itself from the reach of evidence.
The answer this paper commits to is narrower than the version that objection kills, and it has three parts. First, the stock/flow distinction: the Bank of England’s own figures put AI issuers at 41% of non-refinancing US high-yield issuance this year against roughly 1% of the index’s outstanding stock. Spreads price the stock; the risk this paper maps is the flow, compounding into the 2027 commitment season — and the official sector’s own 2026 measurements sharpen it: the BIS Annual Report (June) put AI at roughly half of investment-grade issuance, warned of “a complex web of private arrangements” with “risks of the same asset being pledged multiple times,” and found direct lenders’ AI/IT books quadrupled in five years; BIS Bulletin 128 (July) documented $115B of BDC lending to software firms — a fifth of all BDC lending, over 80% of BDC tech books — with delinquencies under 1% and spreads narrowing against a disruption risk the BIS itself calls unpriced; and the FSB’s May report supplies the borrower-quality floor: 10% of middle-market CLO borrowers already lack the cash flow to cover interest, rising toward a fifth-to-a-third once taxes, working capital and capex are counted. The stress side of that ledger acquired names in July: the CEO of BlackRock’s TCP Capital departed amid a valuation probe with losses mounting (July 2026) — and by August 6 the fund had sold a continuation-vehicle stake priced at 95% of December’s marks, absorbed a 10.4% NAV haircut in a single quarter, and engaged bankers to weigh strategic alternatives including wind-down (8-K) — and BlackRock curbed redemptions at an HPS-lineage private-credit fund — gates and probes at the world’s largest asset manager, still idiosyncratic, and exactly where the FSB’s transmission map said to look first. And the neocloud canary’s earliest structured backer — Magnetar, of pre-GFC fame — had by then converted $50M of convertible notes into a $12.5B position and was selling it down through the enthusiasm (filings, fall 2025): the investor who most famously monetized the last cycle’s structuring is monetizing this one’s, on schedule. Second, incomplete revelation claims slow, partial incorporation — not zero: the repricings that have occurred (Oracle’s CDS from ~45 to 200+, CoreWeave’s July covenant restoration at wider spreads) each followed a disclosure event, stepwise, which is what partial incorporation looks like from inside. The Oracle steps have names and dates, and they read like a syllabus of the mechanism: a $10 billion Blue Owl data-center financing that failed to close (December 18; CDS to 156bp that day, then the highest since 2008); a bondholder suit in January — led by a carpenters’ pension plan, exactly the capital the tranching machine is built to reach — alleging the September offering documents said Oracle “may” need to borrow more while it was already planning the $38 billion of loans that followed the $18 billion of notes within seven weeks; and the fiscal year closing (10-K, May 31, 2026) with total borrowings at $129.5 billion, up $37 billion in a single year, beside risk language conceding the company cannot guarantee it will manage its outstanding debt. (The ledger has kept moving since the filing: total debt ~$156 billion by August reporting, FY2026 free cash flow −$23.7 billion on $55.7 billion of capex, and next-year capex guided to $90–95 billion — S&P projects the deficit widening toward $42 billion.) And in July the rating followed the ledger: S&P cut Oracle to BBB− (July 9) — the lowest investment-grade notch — citing customer concentration in its OpenAI-heavy backlog and a projected multi-tens-of-billions cash deficit, while five-year CDS traded at its widest since 2008 and Oracle protection came to account for roughly half of all single-name tech CDS notional outstanding (per July reporting). Each step disclosed; each step repriced; none extrapolated. The sector-level instrument for the same phenomenon now has a named desk behind it: Apollo’s chief economist published the divergence — investment-grade credit spreads widening for hyperscalers while tightening for industrials (ICE BofA indices, 7–11yr) — which is precisely the shape partial incorporation predicts, and it is scored as shared evidence under this paper’s own discipline: single-sector IG repricing while the high-yield middle stays calm is simultaneously the stepwise-incorporation mechanism at work and the counter-exhibit’s spread condition holding. Both clocks read from one chart — and on August 14 the mechanism performed on schedule: with no new disclosure of any kind, a Bank of America analyst attached arithmetic to Broadcom’s off-balance-sheet chip-financing vehicle (a path to $370B of senior debt by mid-2029 at 20GW scale, ~$150B of new issuance in 2027 alone, with Broadcom backstopping up to $29B on the initial transaction) and the stock fell nearly 6% that afternoon. Extraction, not revelation, moved the price — the first single-name repricing of the season on off-balance-sheet quantification alone. The same note generalized the guarantee pattern: two chipmakers in four days (NVIDIA’s CEO-stated “up to 25%” residual support; Broadcom’s $29B backstop) now stand behind the resale value of their own products — the sellers of the collateral underwriting the collateral, becoming standard architecture in real time. And the day supplied its own control group: hours after Broadcom fell on debt arithmetic, AMD rose over 5% on a doubled price target built from a 2030 revenue model. Credit’s clock and capability’s clock, trading against each other inside one sector on one afternoon. Third — and this is the part that keeps the paper falsifiable rather than faith-based — the counter-exhibit carries a date: if high-yield spreads remain inside their historical middle through the 2027 commitment season, the credit leg of this paper is wrong — not early, wrong — and Appendix F will record it in those words. So the reader can score it without asking us: at this paper’s freeze, high-yield OAS stood at 271 basis points (Aug 12, ICE BofA HY index) — not merely inside the historical middle but at single-digit historical percentiles of tightness. The kill condition is not close to tripping; it is emphatically un-tripped, and we print the level so the watching requires no trust. One structural distinction from the same review also belongs here: NVIDIA’s ~$110B of customer support is predominantly equity — disclosed, junior, loss-absorbing — where Lucent’s fatal vendor financing was receivables, senior claims on insolvent customers discovered late. That distinction currently favors the bulls, and it is eroding on schedule: reported talks of an NVIDIA–OpenAI backstop of up to $250B (July 2026) would move the structure toward genuine vendor finance. The sequence behind that number deserves its date line, because it names who declined to hold this risk: OpenAI’s CFO floated a federal backstop for the compute buildout in November 2025, the White House AI czar answered “there will be no federal bailout for AI” within a day, and the CFO walked it back inside the week. The same government had, by mid-2026, taken equity in some thirty strategic-technology companies — Intel to rare earths to nine quantum firms, roughly $27 billion of peacetime stakes with no exit mandate — and it drew the portfolio’s line at AI. The $250 billion guarantee under discussion is therefore the private substitution for a public backstop that was asked for and refused: the vendor stepping into the underwriting seat the state left empty, while the state’s actual accommodation arrived as regulation instead (the securitization carve-out this Part records below). That line moved as this paper closed. On August 10 NVIDIA announced six “compute financing platforms” with Apollo, BlackRock, Blackstone, Brookfield, Goldman Sachs and KKR, to mobilize more than $500B of third-party capital — and its CEO said the company “may provide residual-value support of up to 25%” on some projects (Huang, Aug 11, per Bloomberg and Fortune; the release itself contains no mechanics, and the agreements are unexecuted). The buy-side said the quiet part on the record within a day — “Nvidia keeps trying to help its customers find money to buy its chips… it inflates demand for Nvidia’s products” (UBP’s Vey-Sern Ling, via CNN) — and Michael Burry’s five-year NVIDIA CDS observation (roughly doubled in two months) arrived the same week. The mechanics the release omitted, the principals supplied on television the next day — and this paper could not have commissioned better testimony for its title. On CNBC’s panel (Aug 10–11): Huang — “These systems are not like our PCs, not like our phones. These are revenue-generating assets now.” (In the authored post accompanying the platforms — titled “NVIDIA AI Factory Compute Is Becoming an Investable Asset Class” — Huang answered the return question in his own text: “The return is in the usefulness of AI.” An asset class whose declared yield is usefulness: the underwriting question this paper asks, posed by the underwriter.) Goldman’s Solomon — “These are real assets. They have real value.” KKR’s head of digital infrastructure, Waldemar Szlezak — “You can think about it as a revenue stream, and you can securitize it or effectively divide that risk and sell it to investors who want to participate anywhere in that stack.” And Larry Fink, asked to size the opportunity, reached for his own origin story: it reminded him of “when I started in the mortgage-backed securities market in the 1970s.” Read those four statements in sequence and the thesis of this paper is no longer an interpretation; it is the pitch. The seller of the collateral declares it an asset class; the investment bank blesses the collateral’s realness; the private-capital principal describes tranching it to any risk appetite; and the man who helped build mortgage securitization names the precedent himself, as a recommendation. The securitization of intelligence, announced by its underwriters, on the record, in the same week this paper’s adversarial review demanded we prove the phenomenon exists. Sourcing graded per this paper’s standard: the guarantee is CEO-stated, not yet contractual — and widely misquoted (the “25% stakes” circulating is a conflation of the support cap with equity). If the support lands in contracts, the seller of the collateral is underwriting its own useful-life assumption — claim 0003’s securitization completed, with the guarantee a contingent liability on NVIDIA’s book at a scale it has never carried. The adjudicator is dated: NVIDIA’s Q2 filings (Aug 26) either carry contingent-liability language or the guarantee remains rhetoric. Both readings printed within the week: credit markets took the platforms as risk-spreading (NVDA five-year CDS 73bp, down from an 82bp late-July peak; one major desk: financing risk “materially reduced”), while the most famous bear alive called it “a Wall Street stunt” — and, for the first time, dated himself: “my base case is 2028.” Noted with respect, and with the asymmetry preserved: a base case is a date, not a kill condition; ours remain in Part IX.
It moved again the day this revision closed. On August 14 the Wall Street Journal reported, citing people familiar with the matter, that NVIDIA has revised its support for the proposed OpenAI data-center project in Ohio and is now expected to initially guarantee less than $120 billion — down from the $250 billion previously discussed. Three details in the reporting sharpen what the headline number alone would miss. The reduced guarantee covers only the project’s first phase — roughly 800 MW of a proposed 10 gigawatts in Ohio, developed by SoftBank’s SB Energy at a projected cost above $500 billion, powered by 9.2 GW of new-build generation, most of it natural gas (the permission-regime workaround this paper maps in Part III, here at anchor-project scale). OpenAI’s binding lease for the full campus remains unsigned — the obligation the guarantee would backstop does not itself yet exist. And the reported cause of the cut was not only underwriter discretion: per the Journal’s reporting, the revision followed investor concern about NVIDIA’s risk exposure to its financing commitments — the vendor-financier’s own shareholders rationing the loop. That is the first measured datum of a bound this paper has argued must exist: when the seller of the collateral is also its credit support, the circuit’s capacity is capped not by the borrower’s appetite but by the guarantor’s equity holders’ tolerance — and between late July and mid-August they marked that capacity down by more than $130 billion. The weekend the Journal said the phase-1 deal could sign, it did not — and reporting added a third leg instead (The Information, Aug 15, via Reuters): NVIDIA in talks to take up to $3 billion of equity in SB Energy itself — roughly half at signing, the rest in the developer’s planned September IPO — alongside credit support The Information sized at ~$100 billion (the delta against the Journal’s “under $120 billion” unreconciled at this writing). The guarantor of the financing, buying equity in the developer of the collateral, ahead of that developer’s own listing: the circle acquires a real-estate arc. And on the morning this paper froze, the deal executed (NVIDIA Newsroom, August 17): NVIDIA guarantees SB Energy’s PORTS-Pike Technology Campus — credit support on land, power, and shell buildout, dollar figure conspicuously absent from the release — takes 4.25 IT-gigawatts of initial capacity with an option on the remaining 3.75, invests the first $1.5 billion in SB Energy, and receives in exchange the term that names what the guarantee purchases: NVIDIA will be the exclusive AI compute infrastructure provider at the site. The seller of the collateral now underwrites the collateral and contractually excludes every competing seller from it — vendor finance with a non-compete, stapled to a 20-year OpenAI lease, on a decommissioned Department of Energy uranium-enrichment site with the DOE and Commerce named as partners. The state that refused to guarantee this buildout now hosts it. The executed guarantee’s dollar figure goes where every number in this chain has gone: to the August 26 filings, which remain the adjudicator. Read the sequence, not the headline: a $100 billion equity investment announced in September 2025, reported stalled by January (the Journal’s sourcing had Huang privately questioning OpenAI’s business discipline); a residual-value guarantee stated by the CEO but never executed; a $250 billion backstop that reached print in late July; and now an anchor guarantee cut roughly in half before a single dollar of it exists. Every number in this chain has so far traveled in one direction — announced large, delivered smaller or not at all. That is not a criticism of NVIDIA’s judgment; halving your exposure to a counterparty whose discipline you privately doubt is exactly what a rational underwriter does. It is a criticism of the market convention that books the announcement and never marks the revision. The August 26 filings remain the adjudicator: what shows up in the 10-Q’s commitments and contingencies is the executed number, and this paper will take that number over any of the announced ones. The calendar has since compounded that date into the most disclosure-dense week of the season: August 26 carries NVIDIA’s earnings and filings and the PCE print that feeds the Fed’s September decision; August 27–29 is Jackson Hole — the new chair’s first, pre-billed by Warsh himself as a “big picture” speech from a Fed “not constrained by market prices,” under the symposium’s now-official theme, “Financial Innovation: Implications for Payments and Policy.” (Correction of record: this paper previously listed August 30 as the Treasury’s dated statement on the yen operation; the official accounting in fact belongs to the July–September quarterly FX report, published around November. The gauntlet is three dated disclosures, not four.) The week has acquired two more edges since it was first drawn: the FOMC minutes land August 19 — the same day the VIX expiration begins un-pinning the tape, and with a 130-word statement behind them the minutes carry unusual weight; and Governor Cook’s response to the White House’s removal effort is due August 26 — the eve of Jackson Hole — putting a Fed-independence flashpoint on the gauntlet’s doorstep. We do not predict what any of them will say; we note that by month-end the market will know three things it currently only narrates. And the filings already carry the reverse leg of the circle, executed and scheduled: NVIDIA’s Q1 FY2027 10-Q discloses $30 billion of multi-year cloud service agreement commitments — the chipmaker contractually renting compute back from the clouds that buy its chips, on a payment schedule running into fiscal 2032 — alongside $119 billion of supply and capacity commitments. The forward leg of vendor finance is announced, revised, and unexecuted; the reverse leg is signed, filed, and growing. That asymmetry is the architecture of claim 0003, visible in a single filing.
While the private architecture was being announced and revised, the public guardrails moved the other way. In late July the SEC’s staff — responding to a query from Latham & Watkins on behalf of issuer clients — exempted data-center securitizations from the crisis-era risk-retention and Reg AB disclosure regimes, on the reasoning that data centers are not financial assets that liquidate over time like loans (Bloomberg, Aug 10; CMBS structures keep their rules because there the collateral is a mortgage). The market this touches grew from $2.4 billion of annual issuance in 2020 to $15.5 billion last year and is tracking toward a record in 2026. Hold the two 2026 ledgers side by side: the BIS warning of “a complex web of private arrangements” with “risks of the same asset being pledged multiple times,” the FSB mapping borrower-quality floors — and the securities regulator, in the same season, removing skin-in-the-game and disclosure requirements for the asset class at the center of the web, by staff letter rather than rulemaking. The official sector is measuring the risk with one hand and deregulating its funding channel with the other. Whatever else that is, it is not a system preparing to say no.
Part V — The Demand Question: the layer where the base rates rot#
The supply chain is booming and the demand base beneath its enterprise pool is deteriorating — both are true, because they are different pools connected with a lag.
The gap now has an aggregate arithmetic: industry estimates put the AI revenue needed to justify current investment at roughly $2.5 trillion per year, against measured median enterprise spend of $10.66 per employee per month (and a Bank of England survey in which nine of ten executives reported no productivity difference from AI over three years). One counter-grain datum belongs beside those, because it points where Part VI points: the share of new business founders using AI to start their companies doubled to 60% in two years — adoption compounding at the innovation edge even as it stalls in the incumbent cost line. That split is the dynamo thesis, observed in the wild.
The level is the bear’s fact; the slope is the bull’s, and honest arithmetic prints both. Between late 2025 and mid-2026 the model layer’s disclosed run-rates went from roughly $13B to $70B+ (one lab’s, $9B to $47B in about five months, across funding disclosures carrying securities-fraud exposure); Microsoft closed its fiscal year with $678B of contracted future revenue, up 84%; Google’s monthly token volume rose ~330x in twenty-four months; the AI coding category went from ~$5B to ~$13B in two years. Compounding at that slope closes $2.5T gaps on infrastructure timescales — if it holds and if it broadens. The bear’s rejoinder is the breadth: the median firm’s spend was independently re-measured in August 2026 at $11.95 per employee per month — by a card-transaction dataset titled, without apparent irony, “Cracks in the AI thesis” — and the largest consumer lab’s run-rate was reported flat from February through mid-year at ~$25B against a projected ~$14B annual loss. So the question this Part actually poses is narrower than “is there demand”: it is whether the slope broadens beyond a handful of contracted channels before the 2027 obligations arrive. A race with a date, not a verdict — and Part IX carries its falsifiers.
The verified base rates (originals checked, not retellings): S&P Global’s 2025 survey found 42% of companies abandoned most of their AI initiatives — up from 17% the year before, a year-over-year tripling; on average ~46% of proofs-of-concept were scrapped. Gartner: 30% of GenAI projects abandoned post-POC (2024 call), and >40% of agentic AI projects to be canceled by end-2027 (official, June 2025). McKinsey: ~88% report AI use; only ~39% report measurable EBIT impact. The realized enterprise value, where it exists, is overwhelmingly labor cost per unit of productivity — which is Part VI’s subject.
The under-tracked leading indicators: insurance and liability. Verisk/ISO generative-AI exclusion endorsements are rolling through US commercial general liability policies in 2026 — propagating by default at renewal since ISO forms underlie most of the market — and the Air Canada precedent (companies liable for their AI’s statements regardless of delegation) is compounding into a lineage. Uninsurable means undeployable for regulated industries; carrier behavior is a leading brake on enterprise AI that almost nobody trades. Both are cheap to monitor via the law-firm client-alert corpus.
The transmission map: AI hardware revenue splits into (1) frontier labs and hyperscaler internal demand — currently funding effectively all of the capex wave — and (2) enterprise deployment, where every abandonment statistic lives. Pool 2’s rot has not yet touched pool 1’s reported numbers (the week of August 11: Lumentum guiding +25% sequentially, Supermicro booking $60B of orders, CoreWeave and Nebius beating). Pool 2’s rot did, however, acquire its most direct measurement yet: Careerminds’ February 2026 survey of 600 HR professionals who actually conducted layoffs found 68.3% of companies that cut AI-driven jobs are rehiring — a third of those bringing back more than half the eliminated roles, most within six months — with 32.9% reporting lost critical skills, only 21.4% saying automation fully replaced roles without operational problems, and more than half conceding the AI “required significantly more human oversight and judgement than originally anticipated.” The labor-savings half of every enterprise AI business case is being refunded in salaries, at boomerang premiums, one rehire at a time — which is what “realized enterprise value remains mostly labor arbitrage” looks like when the arbitrage reverses. The lag runs out when enterprise disillusionment slows the labs’ and hyperscalers’ revenue growth enough to check capex. Gartner’s end-2027 timestamp is the first calendar anchor; the standing tripwire is the phrase “enterprise AI demand softness” (or its cousins — “elongated AI sales cycles,” “POC-to-production conversion”) appearing on any hyperscaler or major-SaaS earnings call. Zero marginal cost to watch; we read those transcripts anyway.
The tokenomics cut both ways: inference prices deflating roughly 10x/year on a capability-adjusted basis (frontier-tier list prices fall more slowly; the capability-adjusted number is the one vintage economics feel — and it now carries its sources, resolving what an earlier revision flagged as the weakest-sourced number in this Part: the ~10x/yr figure originates with a16z’s fixed-capability-threshold analysis (Appenzeller, Nov 2024: $60 to $0.06 per million tokens, 2021–2024, at constant MMLU), and Epoch AI’s March 2025 measurement brackets it at 9x to 900x per year depending on the capability threshold — 10x is the floor of the measured range, with Epoch’s own caveat that the fastest declines are recent and may not persist) make enterprise adoption ever more feasible while making revenue-per-deployment ever thinner — and they are the quiet executioner of Part III’s “value tier” narratives — and the deflation acquired a measured accelerant this season: OpenRouter and Andreessen Horowitz’s empirical study of 100 trillion tokens puts Chinese open-weight models (Qwen, DeepSeek, Kimi) at nearly 30% of global usage, up from 1.2% in late 2024 — a competitor whose marginal price is approximately zero taking a third of the volume in months. (A circulating “more than half of global usage” version overstates this; the measured share is ~30%, with Western proprietary models still at ~70% — corrected here as usual.) The plan that justifies the buildout needs inference scarce and pricey; the token data says it is becoming abundant, and a meaningful share of it free, while the exclusive version is still being financed. The rented-compute market has already voted: GPU rental rates fell from roughly $8 an hour in 2024 to under $1 by early 2026 (Research Affiliates) — an ~8x collapse in the price of the very asset class the securitization machine proposes as collateral. Precision requires the counter-tape too, and it changes the reading from a slide to a cycle: Apollo’s compute-shortage work has H100 spot rates re-tightening from $1.85 to $2.40/hour between late 2025 and March 2026, on-demand capacity “effectively sold out,” and spot DRAM up ~8x since early 2025, as agentic workloads consuming 100–1,000x the tokens of chat arrived into the installed base — and the broadest public index (76 providers, August 10) now sits about 10% above its September-2025 low and up 6% on the year. Collapse, then re-tightening: the collateral’s price is cyclical, which is worse news for a securitization than either direction alone — you can underwrite a depreciating asset and you can underwrite an appreciating one, but a collateral class that traversed 8x down and then 30% up inside two years has no stable basis for a residual-value curve at all. And the same analysis supplies the capex-quality arithmetic this Part needed: Brightman’s “capital churn” — 2026 hyperscaler capex of ~$650 billion against hardware whose economic life runs ~3 years while its accounting depreciation runs 5–6 means less than a third of headline capex (~$215B; ~$125B under a 2-year life) is net capital formation; the rest replaces equipment already economically dead, defending position without creating capacity. The buildout’s headline number measures spending, not accumulation — which is precisely the distinction between an investment boom and an arms race, and the useful-life gap between the economic and accounting numbers is the same gap the residual-value guarantees exist to paper over. This lands on Part III’s “value tier” narratives, in which aging GPU fleets allegedly earn their keep serving cheap inference. A value tier whose prices fall 10x annually must grow utilization nearly 10x annually just to keep vintage revenue flat. The claim that old fleets are long-lived assets and the claim that new capacity is being added at record pace are in structural tension: record new gigawatts push existing hardware down the value tier faster, consuming the scarcest resource (powered slots) at the lowest margin in the fleet. An analyst probed the roll-off economics on the August call (“recontract… spot or in your inference products?”); the answers were flexibility-and-margin language, not numbers, and neither GPU useful life nor depreciation was discussed anywhere on the call — the issuer consistently preferring strategy vocabulary (“value,” “proven ROI”) to accounting vocabulary. The sharpest form of the question — legacy contracts consuming scarce powered slots that new hardware would earn multiples on — has not yet been put to management in those words; it stands as this paper’s open question for the next call.
The vendor now supplies the yardstick too. On August 10 OpenAI’s CFO published an “AI-native finance” playbook whose centerpiece is a four-question enterprise AI-ROI scorecard: Did AI complete work that mattered? What did it cost? Was the result good enough to use? Did it help us move faster? Read against this Part’s base rates, the notable feature is what the four questions do not ask: none requires a measurable revenue or cost-line impact. It is a qualitative, vendor-authored success rubric published at precisely the moment the quantitative base rates (42% abandonment, 61% no-measurable-impact) rot in the vendor’s disfavor — the demand layer’s sibling of the supply layer’s “value token processing,” and the same anchoring mechanism the incomplete-revelation paragraph describes: replace the number the buyer would compute with the vocabulary the seller prefers. When the seller of the product is also the author of the metric by which buyers are invited to judge it, the metric belongs in the pattern file, not the model.
A watch item attaches — as gauge, not clock. The same CFO’s publishing tour lands amid visible IPO-readiness choreography (an internal “IR-GPT,” zero-day-close finance automation, trade-press linkage of the playbook to IPO preparation) — and it lands two months after the season’s first mega-private already crossed over: SpaceX listed June 12, 2026 in a record debut (+19% first day, against a reported ~$1.5T valuation ambition), with credit-market commentary noting CDS on its debt appearing within a week of the listing, independent analysts flagging its prospectus by August — and, by mid-August reporting, the stock round-tripping to its IPO price within two months amid unlock chatter and short interest near 40% of float (subsequently measured at ~45%, with the stock then rebounding some 40% off its low by mid-August and short sellers reported “running out of bullets” — the gauge reads window quality as violent two-way volatility, not as a verdict): a dated, unflattering read on the quality of the very window OpenAI is dressing for. Two mechanics inside that round-trip deserve their own lines, because each measures something this paper otherwise only argues. First, the passive floor was measured and found thin: Nasdaq rewrote its inclusion rules to fast-track the listing into the Nasdaq-100 on July 7 — fifteen trading days after the IPO — delivering an estimated $22–27 billion of rule-bound passive buying, force-marching millions of 401(k)s into the stock near $160 (over $1 billion of retirement-account losses by late July, per the coverage) — and the price fell through the forced bid, below its own IPO price. The ~$1.6 trillion household passive flow this paper tracks is usually imagined as a floor beneath the market; the boom’s newest listing measured its thickness in public — for every rule-bound buyer at the front door, an informed seller left by the back. Second, the faith-priced currency spent itself while still believed: four days after the IPO, the company made the largest startup acquisition in history — $60 billion for the maker of Cursor — paid entirely in newly issued stock. Real assets bought with printed belief, the bill delivered to every existing holder as dilution, in the same season the SEC exempted the sector’s collateral from crisis-era rules. And the machine is already selecting its next passenger: the same coverage now flags Anthropic’s prospective listing as the next candidate for fast-tracked index inclusion — the socialization of exposure by rulebook, one IPO at a time. One mega-private through the window at a trillion-plus mark and the next visibly prepping is a sharper late-cycle gauge than two mere preparations would be: the largest private balance sheets in the world accessing public liquidity while it is widest. It carries no trigger date and no failure mode of its own, so it stays off the spiral checklist; it goes in the pattern file beside the metric above. (Correction of record, same day: this paper’s v2.0 text briefly described SpaceX as still private at publication; it had listed in June. Caught by a routine verification sweep of an external commentary transcript — the season’s recurring hazard, a stale assumption wearing a fresh sentence, caught this time in our own paragraph.)
The gauge produced two readings in the same week, pointing opposite ways. The bull reading: the same CFO told investors on August 14 that enterprise revenue now exceeds consumer — on a reported ~$40 billion annualized run rate, roughly double the end of last year — which, if the mix claim survives a prospectus, would be the strongest answer yet to the “consumer subscription ceiling” objection. The bear reading, same day: the chief revenue officer announced her departure after roughly eight months in the seat, following two other senior executives out the door earlier in the summer, while an August secondary let insiders sell about $7 billion of stock ahead of the listing; the financial press called the exodus a “huge red flag,” and prediction markets priced roughly one-in-five odds of a listing by year-end. This paper does not adjudicate between the readings — the prospectus will. What it notes for the record is the shape: revenue that doubles while the people closest to the revenue sell their stock and leave is not a pattern that requires a bear to find interesting. The gauge stays as designed — no trigger date, no failure mode of its own — but the pattern file now carries both columns. Two refinements complete the instrument. First, the gauge now watches both labs: Anthropic’s $65 billion round in May valued it at $965 billion — overtaking OpenAI as the most valuable AI startup — so the two firms that anchor half a trillion dollars of hyperscaler backlog (Part III) both carry near-trillion private marks against combined operations that lose money. Second, the higher-frequency instrument: until the S-1s land, the labs’ funding rounds are the industry’s heartbeat — each round is the moment the two-thirds-of-a-trillion of booked future revenue gets refinanced on faith, and a round that closes smaller, slower, or at a flat-to-lower mark than its predecessor is the earliest publicly visible sign of the faith faltering. We add it to the watch list as exactly that: not a prediction that rounds falter, but the instrument that would show it first.
The strongest objection, steelmanned#
The Situational Awareness camp would reject this Part’s premise, and their best argument deserves its full weight. It runs: the abandonment statistics measure the deployment difficulty of 2024–25-era models, not the technology’s ceiling; capability is compounding on its own curve (reasoning, context, agentic reliability), and when reliability crosses task-employment thresholds, the enterprise demand pool converts at once rather than gradually — at which point today’s capex reprices from speculative to prescient, the way AWS’s derided mid-2010s buildout did, and the way railroad overbuilds eventually carried real traffic. Under that branch the housing analogy fails at its core, because housing’s collateral could never become ten times more productive while the debt against it seasoned — but a GPU fleet’s utilization economics can, if the models running on it jump a capability class. This is a coherent, falsifiable position held by serious people, and this paper’s thesis is not that they are wrong about the technology. The bet is narrower, and it is a forecast, not an observation: that monetization arrives on capability’s clock while the obligations arrive on credit’s clock — and that credit’s clock will prove faster. The tense matters, and the live evidence against the present tense is stated here rather than hidden: as this paper closed, high-yield spreads sat in the tightest decile of three years, the largest AI debt deal of 2026 had drawn the largest order book ever recorded, and every official body that examined the mechanism this year found present impact modest (Part IV carries the full counter-exhibit). Even this exhibit now wears a date, though: by August the newest jumbo AI deals — NVIDIA’s $25 billion, Amazon’s $25 billion, SpaceX’s $25 billion — had widened after pricing rather than tightening, Meta’s $12.3 billion El Paso SPV covered only ~1.4x against a ~4x 2026 investment-grade average, and JPMorgan’s syndicate desk described “indigestion,” with banks now spacing deals and running pre-launch roadshows. Absorption is still absorption; it has stopped being effortless. The divergence is testable on schedule: if agentic-project cancellations come in materially below Gartner’s >40% by end-2027, if enterprise POC-to-production conversion turns decisively up, if lab and hyperscaler revenue-per-dollar-of-capex inflects before the 2027 commitment cliffs — then capability caught the debt schedule, this paper’s Part IV window dissolves benignly, and the pre-registered entries get scored as misses. Both camps’ bets are now on the calendar.
Part VI — Innovation vs. Productivity: the dynamo thesis and the K#
The dynamo thesis#
The best-pedigreed idea in this paper is borrowed from economic history (Paul David, 1990): electrification paid almost nothing for decades while factories swapped steam engines for electric motors on the same floor plan — and paid enormously when production was redesigned around the new physics (the dynamo, the distributed motor, the reorganized factory). Early IT ran the identical arc (the Solow paradox, resolving only in the late 1990s). The prediction for AI follows: companies using AI as labor arbitrage on an unchanged business will capture a one-time margin step that competition erodes; companies using AI to redesign what they produce will compound. The 2023 language (“generative AI will transform everything”) has already downshifted to 2026’s “agentic workflows, outcome-focused” — the vocabulary of downsized expectations, exactly on the historical schedule.
The identification problem is that “innovator” is not a disclosure. It must be inferred from filings: revenue acceleration that outruns headcount growth; new-product and new-segment revenue share rising; R&D-to-growth conversion improving; gross margins expanding alongside rising unit output (innovation) rather than alongside shrinking payroll (arbitrage — which specifically disqualifies); AI appearing in the product and roadmap sections of the 10-K rather than the cost-efficiency paragraph. This five-criteria screen is the ownership sleeve’s gatekeeper (Part VIII).
The K amplification#
Where enterprise AI does deliver, it delivers labor cost reduction — and the post-war record on productivity windfalls is unambiguous about where those gains land: capital and senior management, not labor. That is not a moral observation but a flow-of-funds one, and it explains the otherwise odd sociology of the moment: the C-suite and investor class pushing AI adoption hardest onto workforces that see 61% of deployments produce no measurable financial impact. The macro consequence is a steeper K: asset-owners compound (melt-up + buybacks + margin capture) while wage-earners face the automation discount. The K is already legible in single-week earnings juxtapositions — a luxury house beating and raising on pricing power the same morning a pet-medicine giant fell 24% on collapsing middle-class vet visits. AI does not create the K, but at the current policy mix it is an amplifier on both legs. And the bottom leg stopped being anecdotal: the New York Fed’s Q2 2026 Household Debt report (Aug 11) showed roughly 13% of credit-card balances 90+ days delinquent — approaching the Great-Recession peak — with student-loan serious delinquency at post-2020 highs and auto delinquency near records, all while equity indices sat within half a percent of all-time highs — a deterioration that has been building since 2023 along the post-COVID normalization path, so the series is old; what is new is its coincidence with record asset prices and its arrival in the Fed’s own framing. Precision the honest version requires: those are stock measures — the share of balances already 90+ days delinquent — while the same Q2 report’s flow language is calm (aggregate serious delinquency 2.57%, “improved slightly”; transition rates “held steady over the past two years,” total balances down $13B on the quarter). Elevated stock, steady flow: the damage is done and parked, not presently accelerating. (The Fed’s own Liberty Street researchers add a mechanical caution against the stock number itself: the share of charged-off debt still being reported roughly doubled since 2022, so part of the headline 13% is old losses lingering on the books longer, not fresh distress — the reading that most weakens this paper’s use of the number, carried here per house rule.) And the divide runs through the middle of single markets, not just between them — Fitch’s subprime auto 60+ day delinquency index printed a 32-year high in the same season the NY Fed’s whole-auto-book serious-delinquency transition held steady at 3.00%. The auto market is itself K-shaped: the bottom of the borrower distribution is at generational stress records while the blended book reads “steady.” Aggregates are where the K goes to hide. And in the paper’s final week the K printed at macro scale, in federal data, four days apart: Wednesday’s PPI carried portfolio-management fees at +6.5% — the asset economy inflating in producer prices — and Friday’s Census advance report had July retail sales at −0.6% against +0.1% expected — the weakest print in more than a year, and broad: autos −1.8%, gasoline −0.9%, even online stores −2.2% (the bull reading attributes part of the miss to calendar — Prime Day moved earlier out of July, World Cup spending concentrated into June — and is carried here as the counter-reading), with ex-auto-and-gas down 0.2%, the GDP-feeding control group down 0.4% against +0.3% expected (a “below the entire 50-economist range” claim and a June downward revision circulated in same-day coverage but did not survive re-verification against the Census release, and are retired here), and household inflation expectations ticking up to 4.3% in the same survey week — the same University of Michigan preliminary that had sentiment collapsing to 51.0 against 54.5 expected: expectations up, mood down, the household sector reporting stagflation directly (“disappointing on all levels” — Navy Federal’s chief economist; Pantheon Macroeconomics warned of “a sharper slowdown ahead” as tax-refund support depletes). The asset economy and the consumer economy moving in opposite directions inside one week of official statistics is not commentary; it is the divide, stamped twice by the government’s own presses. The regime read cuts the same way as everything in Part II: a softening consumer lowers hike odds and feeds the melt-up while quietly thinning the demand floor beneath the boom’s obligations — both branches fed by a single print. The NY Fed’s own researchers now describe the configuration in exactly this paper’s vocabulary: a persistent “K-shaped divide.” Record delinquency and record asset prices in the same week is not a contradiction; it is the K, measured at both ends simultaneously. The labor market’s newest entrants supply the generational read, held here with both hands per this paper’s discipline. The fact: unemployment among young college graduates (22–27) reached 5.3% by March 2026 — above the 4.3% national rate, a historic reversal of a premium that stood at 1.9 points in 1979, and higher than the worst of the 1990 and 2001 recessions (NY Fed / EPI; a circulating claim of “higher than all four prior recessions” overstates it — 2008 and 2020 were worse, and this paper corrects the overstatement even where the direction serves its argument). The counter-reading, carried at equal strength: EPI’s composition work finds ~98% of the rise came from higher participation, not job loss — employment-to-population flat since 2024 — and non-college young workers (7.1%) deteriorated in parallel, which makes the fashionable “AI is eating entry-level jobs” conclusion premature on the evidence. What survives both readings is the K within the cohort: a degree now buys no unemployment advantage over the economy at large for the first time in the data, while the young workers without one carry 7.1%. Whether AI did it is unproven; that the bottom rungs of the ladder are crowded while asset owners compound is measured.
The China iteration model, and repatriation skepticism#
Two adjacent structural views round out the frame. First: US manufacturing “repatriation” is, so far, mostly construction spending narrated as production capability. Process knowledge — the thing that actually makes manufacturing competitive — was exported over decades and does not return with the buildings (a decade of domestic fab struggles is the exhibit). Where reshoring works, it imports the knowledge or automates past the labor moat; the investable layer is the automation and equipment complex, not the renaissance narrative. Second: China’s industrial model — enter a category with cheap, low-margin, high-volume products and let iteration compound process knowledge until generation N is superior (solar → batteries → shipbuilding → EVs, with mechanical watches visibly early-cycle and July 2026’s memory-sector shock visibly mid-cycle) — functions as a slow, standing margin-compression force on any Western industrial whose moat is process knowledge currently being iterated upon. Both views argue for skepticism toward manufacturing-renaissance equity stories and respect for the equipment/automation layer.
Part VII — The Valuation Lens: what prices imply, in numbers#
Narratives argue; reverse-DCF computes. The method (Rappaport/Mauboussin): rather than forecasting and comparing, solve the DCF backwards — extract the FCF growth rate the current price already requires, then judge it against base rates (only a few percent of companies sustain >20%/yr for a decade; past growth barely predicts future growth). The companion concept is EPV (earnings power value — Greenwald): sustainable FCF capitalized at the cost of capital, minus net debt; the value of the business assuming zero growth. EPV coverage is the fraction of the price that requires no future; the remainder is priced belief. At a 9% cost of capital the fair no-growth P/E is ~11×, so EPV coverage ≈ 11 ÷ P/E for an unlevered name — the rigorous form of the instinct that P/E 30 means two-thirds of the price hasn’t happened yet.
Selected readings (author’s tooling, EDGAR fundamentals, August 11–12, 2026 prices):
| Name | Price | EPV coverage | Implied FCF growth (10y) | Reading |
|---|---|---|---|---|
| CME | $285 | >100% | −16.6%/yr | Priced below no-growth value |
| Newmont | $92 | 85% | ~0%/yr | Gold miner priced for zero growth at record gold |
| Autodesk | $247 | 61% | 4.8%/yr | AI-native franchise priced like a utility |
| Netflix | $74 | 41% | 9.5%/yr | Reasonable |
| Microsoft | $487 | 20% | 18.8%/yr | Year-10 FCF $378B required |
| ISRG | $402 | 19% | 21.4%/yr | Base-rate edge |
| Lumentum | $813 | 18% (fwd FCF) | ~19.8%/yr | Trailing FCF negative — earnings ≠ cash |
| Eli Lilly | $1,215 | 6% | 29.8%/yr | Priced as a decade unicorn |
| AMD | $496 | 6% | 37.3%/yr | Faith-priced |
| Palantir | $170 | ~2% | 41.5%/yr | May be the best innovator; already fully priced as one |
| CoreWeave | $89–99 | n/a (FCF < 0) | no solution | A transition bet, not a growth rate |
Three synthesis points. First, the barbell is visible in the table: transaction monetizers and gold miners are cash-backed (some priced below their own no-growth value) while the AI complex runs 80–95% growth premium — the two-branch portfolio writes itself. Second, “innovator” and “sanely priced” rarely coexist: the market has found Palantir, Lilly, and Tesla; the investable question is the mispriced innovator (Autodesk at 4.8% implied, a crashed Duolingo at ~1%, Novo at a no-growth multiple), which is what the dynamo screen exists to adjudicate. Third, high multiples are long-duration assets — mathematically kin to 30-year bonds — which is why the AI complex and the Treasury term premium (Part II) are one trade wearing two costumes, and why the 10-year auction tape matters to people who think they only trade tech. A method honesty note: implied growth is sensitive to the discount rate (±1 point of WACC moves implied g by roughly 2–3 points), so the table’s freight is carried by the tiers and rank order, not the decimals — a name does not migrate from CASH-BACKED to FAITH-PRICED on any defensible WACC.
Part VIII — Positioning: the horizon barbell#
The structure that falls out of Parts I–VII is a barbell by holding horizon, not by direction:
The rental sleeve — the AI production layer, held only while trend confirms. Entries are mechanical (breakout rules); exits are trailing stops or event-window rules, never renegotiated; the stop is the lease expiring. These names are rentals by valuation construction (80–95% growth premium): you hold other people’s expectations, and you do not marry them. Sleeve capped at 40% of the account; killed automatically by two spiral tells. Its short-term gains are, deliberately, the operator’s income stream. Within it, four beta tiers: mega anchors (NVDA, AVGO, TSM — reference, move least), mid-cap torque ($2–60B names with contracted hub exposure: hosts, optics, power, interconnect — the second-derivative movers that reprice 2–3x the megas on hub news), the neoclouds (highest beta, credit-sensitive — the canaries of Part IV), and — a direct consequence of the securitization thesis — the arranger tier (Apollo, Blackstone, KKR, Brookfield): the 2005–07 desk analog, paid in fees on deal flow regardless of the paper’s fate, and whose stalling on new SPV announcements would itself signal saturation.
The ownership sleeve — dynamo-screen innovators, accumulated slowly on schedules, sized to survive a 50% drawdown, held for years (and for long-term tax treatment). Until the screen formally promotes names, the sleeve holds nothing: hypotheses do not get capital. Current screen-priority candidates on price alone: Autodesk, Duolingo, Novo Nordisk, Netflix, Intuitive Surgical. Already-priced-as-innovators (rent-only until repriced): Palantir, Lilly, Synopsys, Cadence, Shopify, Tesla, SpaceX.
Ballast — the both-branches foundation: cash-backed transaction monetizers (exchanges, market-structure — levered to activity, not direction; they get paid in melt-up and crash alike), the gold complex (Branch B’s confirmation leg that also survives Branch A), and EPV-solid affluent-consumer names (the K’s resilient leg at reasonable multiples).
The fork, operationalized#
The regime machinery of Part I and the portfolio above compose into one operating table — what is done now, what constitutes the flip, and what is done after:
| Phase | Indicator state | Actions |
|---|---|---|
| Branch B (current) | 0–1 spiral tells; benign-path configuration intact (weak dollar, contained yields, gold bid, bad-news-bought) | Rental entries on trend signals only, trailing stops, sleeve ≤40% at cost; ownership adds only via the screen, on schedule; ballast held; weekly implied-growth book read; no shorts, no hero-sizing, no pre-print entries; tells logged daily |
| The flip | 2+ spiral tells simultaneous and sustained (credit gapping, S&P+Dow breaking together, AI-CDS accelerating, USD/JPY through the line, duration auctions tailing, correlated margin-driven selling) | No new rentals, immediately and unconditionally. Existing rentals run their stops — the sleeve is designed to empty itself; no averaging down, no “it’ll come back.” Ballast and ownership positions are not sold into the panic. The Branch A clock starts |
| Branch A (after the break) | Liquidation confirmed; spreads wide; the net-net count climbing | Staged re-entry begins — on valuation triggers, not price drops: a whale-fall name is bought in scheduled tranches when its EPV coverage recovers past ~60% or its implied growth falls into base-rate range. Ownership-sleeve accumulation accelerates (screen names at drawdown prices are adds by rule). The net-net count gauge is the bottom thermometer: qualifying companies doubling off the baseline (~140–210 float-proxy, August 2026) marks late-stage capitulation |
The whale-fall list, defined. When a whale dies and falls to the deep-ocean floor, the carcass feeds an entire ecosystem for decades. The market analog: when a mega-cap quality franchise breaks in a liquidation, the fall feeds a decade of returns — for whoever pre-committed to what they would pay. The whale-fall watch is therefore built during the melt-up, while thinking is clear: the currently faith-priced quality names this paper’s own valuation lens says are excellent businesses at unownable prices (the hyperscalers, NVIDIA, TSMC, AMD, the networking and litho monopolies), plus the cash-backed names that get thrown out with everything else in a true liquidation (an exchange below no-growth value, a gold miner priced for zero growth). The discipline is that the list carries pre-registered re-entry valuations, not price targets — you are not buying a 40% drawdown, you are buying a specific EPV coverage, however far down that lives. Watching the same names on the way down also feeds the checklist: the generals breaking is liquidation tell #1, so one list serves as instrument panel before the flip and shopping cart after it.
Notably: no shorts, in either branch. The innovation-vs-production pair thesis lives in a paper shadow book until the credit tells fire; shorting a melt-up’s production layer is a thesis paying carry to be early.
Part IX — Falsification: what kills each pillar, and how we score ourselves#
A thesis that cannot fail is a mood. Every pillar above carries pre-registered kill conditions, maintained in claim files and a predictions journal that is scored honestly — misses logged with the same prominence as hits.
- The regime call (Branch B) fails operationally, not intellectually: two spiral tells sustained means the branch has flipped, whatever the narrative says. Holding rentals through that is process failure by definition.
- Fiscal dominance (0004) dies if the Fed hikes materially into elevated financing needs (the dual mandate winning), if bill-share reverses while coupon sizes rise, if duration auctions keep clearing to end-users through full refunding cycles (the August 2026 refunding is doing exactly that: dealer takedown 11.7% at the 3-year, just 8.6% at the 10-year, indirects taking 77% — evidence against the stress leg, honestly logged), or if the term premium sleeps through 7%-of-GDP deficits.
- The timeline (entry #9) is scored on three legs: no sustained liquidation before July 2027; the AI-complex cycle high landing in 2027H2–2028H1 (judged with 2028 hindsight); securitization issuance still growing through 2027H1. The author’s own recorded handicap: right direction, ±12-month error bars, real weight on “earlier” given the CDS chronology.
- The depreciation claim (0003) is adjudicated by disclosed useful-life changes, vintage-level revenue (or its telling absence), and — most cleanly — the advance rates on the first compute-collateralized SPV deals.
- The HALEU bottleneck (0005) dies if a second producer delivers commercial tonnage before 2030 or if DOE targets start landing on time; its mundane null (the fleet slips right, so the bottleneck dissolves in the delay) is scored by which cause projects cite when they slip.
- The demand-rot thesis fails if the abandonment series reverses or the EBIT-impact share climbs decisively; the transmission tripwire is enterprise-softness language in hyperscaler calls.
- The dynamo screen disqualifies its own candidates: two consecutive years failing the criteria, or margin gains revealed as payroll cuts, and a name exits the ownership sleeve regardless of price.
The measurement culture is the actual edge claimed by this paper. Its author’s journal shows fundamentals-legs resolving near-perfectly and short-horizon choreography-legs resolving near-randomly — so the system routes fundamentals to the human, choreography to mechanical rules, and every new conviction through a pre-flight checklist (staleness, unasked questions, sizing against the instrument’s own distribution, expectations positioning, reaction-shape history). The paper you have just read is that process, aggregated.
About the author#
Paul Vilevac has spent thirty years building inside technology firms — including as chief architect of the trading platform at Zecco, one of the first commission-free online brokerages — and the same thirty years trading his own capital and studying economics and macroeconomics. bleenq intelligence is his research operation: the claim files, counterparty graphs, predictions journal, and valuation tooling cited throughout this paper are its working product, built and run by one person on public data.
On skin in the game: over the three years through mid-2026, the author’s personal book returned approximately +225%, long-only, no shorts — built principally on an index position in the boom itself (QQQ), an early position in one genuine innovator (Palantir — entered September 30, 2020, the day it listed, per the broker record), early AMD, and a persistent gold ballast. In retrospect that portfolio was a proto-barbell of exactly the shape Part VIII formalizes — which is the honest frame for this paper’s skepticism: it is not written by someone who missed the boom, but by someone long the boom while mapping its end. The performance figure is a statement of record from personal brokerage accounts, not a solicitation, an offer of advisory services, or a projection; it reflects a period this paper itself characterizes as exceptionally favorable to exactly that positioning. (Verification against broker records is in progress — Appendix F.)
The measurement culture is the credential the author actually claims: every forecast in this paper is pre-registered with resolution dates, the misses are logged with the same prominence as the hits, and the calibration record in Appendix D — including its unflattering choreography column — is published unedited. That is the standard this paper invites its readers, and its critics, to hold it to — and it has already been applied once from inside: before publication, the author commissioned a free-rein adversarial review of this paper (“The Counterparty Brief”); the objections that survived verification are absorbed above, at full prominence, and the review is part of the paper’s record. A companion note, The Forge, the companion note on the trading lab (published alongside this paper), documents the other half of the shop — the high-frequency popper laboratory whose honest ledger (five exit mechanisms tested, five buried) supplied several of this paper’s operating rules. The blades cited here were forged there.
Appendix A — Watchlists (the webs)#
These are watchlists — names under study, not recommendations, and not a portfolio. The author may hold, acquire, or exit positions in any security mentioned, at any time, without notice. See the full disclaimers.
The Horizon Barbell (primary):
- Rental A — mega anchors: NVDA, AVGO, TSM
- Rental B — mid-cap torque: CORZ, APLD, IREN, BTDR, VRT, MOD, BE, COHR, LITE, FN, CLS, CRDO, ALAB, SMCI, MU, CAMT, ACMR
- Rental C — neoclouds: CRWV, NBIS
- Rental D — securitization arrangers: APO, BX, KKR, BN
- Ownership, screen-priority: ADSK, DUOL, NVO, NFLX, ISRG
- Ownership, already-priced: PLTR, LLY, SNPS, CDNS, SHOP, TSLA (SpaceX belongs on this row in spirit but is private — tracked as a thesis note, not a ticker)
- Ballast, K-top: AXP, RL, BKNG
- Branch A — whale-fall watch (instrument panel now, shopping cart after the flip; entries by valuation trigger only): MSFT, GOOGL, META, AMZN, NVDA, TSM, AMD, ANET, ASML, CME, NEM
Transaction monetizers: CME, ICE, NDAQ, CBOE, COIN, HOOD, IBKR, SCHW, VIRT, GS, MS Gold & miners: GLD, PHYS, GDX, GDXJ, B, NEM, AEM, WPM, FNV, RGLD, KGC, PAAS, SLV Nuclear/AI power: CEG, VST, TLN | OKLO, SMR, BWXT | LEU, CCJ, URA | SPXC, GTES, FIX, IESC CoreWeave web: CORZ, APLD, GLXY, DELL, SMCI, NVDA, PSTG, BLZE, CGBD, GECC, OWL, DBRG, SSSS, SYSX Nebius web: CORZ, WYFI, BTBT, SLNH, IREN, AIB, VRT, NVDA, SHAZ AI Commons (intersection of all webs): NVDA (5 webs), VRT (4), ANET/COHR/LITE/ETN/DELL/SMCI/CRWV (3), CORZ (both neoclouds), AMD/CEG/GLW/NBIS/TSM (2). The commons is the ten-second regime dial: hubs rallying while commons lag = capex doubt; commons leading = the buildout broadening.
Appendix B — Claim files in brief#
0003 — GPU depreciation understatement (origin: Burry). Hyperscalers/neoclouds flatter earnings via extended useful lives (~$176B contention through 2028). Live artifacts: a neocloud’s “previous-generation value token processing” framing; a 9-year contract on 2020-vintage hardware (bull evidence if the outer years hold price); the slot-opportunity-cost contradiction; the $500B securitization of the assumption itself; record CDS as the credit market’s running commentary. Adjudicators: useful-life footnotes, vintage disclosures, SPV advance rates.
0004 — US fiscal dominance. Ten assertions with kill conditions spanning FOMC behavior, bill-share, auction internals (dealer takedown trend), FIMA repo recurrence, hedge-fund Treasury share, interest/GDP, real-rate-vs-gold, term premium, official warnings, and the “AI is deflationary” pretext. Scored quarterly against refunding cycles.
0005 — The HALEU bottleneck. US HALEU output 0.9 t/yr today vs a ~9.8GW committed advanced-reactor fleet whose first cores are each due before startup; contractual obligation just 1 tonne by March 2032; DOE program already behind its own targets; Russia excluded; one commercial producer. Kill conditions include any second source delivering ≥1 tonne commercially before 2030. Pattern: allocation bottlenecks hold the pricing power (the CoWoS lesson, transplanted).
Appendix C — Methods: the primary-source pipelines#
Everything in this paper is reproducible by one person with free tools: EDGAR XBRL frames (whole-market balance-sheet concepts in one request — the net-net screen and its count-gauge), companyfacts (per-issuer fundamentals feeding reverse-DCF and the valuation commentary), full-text search (the counterparty graphs; mention-sweeps work for small hubs, curated relationship-maps for mega-caps), Form 4 parsing (the insider ledger), TreasuryDirect result PDFs (auction internals minutes after the print — dealer takedown as the demand truth-serum), and FilingSummary R-file extraction (commitments schedules, debt stacks, useful lives). Secondary sources are date-checked ruthlessly — the season’s recurring hazard was stale articles wearing fresh headlines — and anything that mattered was re-derived from the primary before use. Rules of the shop: the platform’s live feed beats any web quote; paraphrases from live-listened calls are marked until transcript-verified; and every screen and graph logs what it dropped, because silent truncation reads as coverage.
On the counterparty graphs specifically: the first run of a graph is reconnaissance; the diff is the product. A new lender appearing in a neocloud’s filing web, a host vanishing from it, a BDC marking its exposure differently quarter-over-quarter — those deltas are the tradeable information, and they only exist if the baseline was captured while the story was still boring. The same logic governs the insider ledger (the eleventh consecutive week of zero buying is more informative than the first) and the net-net count gauge (a count time-series is a valuation thermometer no single screen run can be).
Appendix D — Predictions journal and calibration (excerpts)#
Pre-registered, dated, scored after the fact; misses retained. Selected record through August 12, 2026: rotation-vs-liquidation week call — HIT; Visa overnight-drop magnitude — MISS (2σ ask, lesson codified into a sizing rule); Ford earnings direction — MISS (anchoring; lesson codified into a staleness check); AAPL results — HIT, its choreography — MISS ×3; AMZN results/capex-framing/bounce — HIT ×3, its AH shape — MISS; the AMZN $250 conditional — HIT on session one; AMD fundamentals — HIT ×2 with two informative misses (margin up, capex tripled) and a reaction leg missed by 0.33%; optics year-end drop thesis — first leg now RESOLVED: MISS, decisively (the drop thesis met a +13.6% post-print rip — the expectations-reset-at-lows relief mechanism the pre-flight had flagged as the tension against the entry); remaining legs open. The aggregate: results-legs ≈ 5-for-5; choreography-legs ≈ 2-for-9. The sample is small (~14 scored legs) — the split is an observed pattern being tested forward, not a demonstrated law, and the routing rule built on it (fundamentals to the human, choreography to the machine) will be re-derived as the sample grows. Open long-dated entries: the optics persistence legs; and entry #9 — the timeline claim of Part IV — first review February 2027, final judgment December 2028. The author’s mental model gets scored like everything else. That is the point.
Appendix E — References and source notes#
Grouped by the part they primarily support. Where a figure appears in the text, it was taken from (or re-derived against) the primary source listed here as of the dates noted; secondary reporting is cited only where it was itself the artifact (e.g., the intervention story). Internal working documents (claim files 0003/0004/0005, the predictions journal, watchlists, and analysis tooling) are the author’s; methodology for reproducing the public-data pipelines is in Appendix C.
Framing and intellectual lineage
- 1. Aschenbrenner, L. — Situational Awareness: The Decade Ahead (June 2024), situational-awareness.ai. The paper this one answers from the market side.
- 2. David, Paul A. — “The Dynamo and the Computer: An Historical Perspective on the Modern Productivity Paradox,” American Economic Review 80(2), May 1990. The dynamo thesis (Part VI).
- 3. Solow, R. — “We’d better watch out,” New York Times Book Review, July 12, 1987 (“You can see the computer age everywhere but in the productivity statistics”). The productivity paradox.
- 4. Mises, L. von — Human Action (1949), on the crack-up boom (Katastrophenhausse). Branch B’s intellectual ancestor.
- 5. Kindleberger, C. — Manias, Panics, and Crashes (1978 and later editions). The displacement→credit→euphoria→distress arc underlying Parts I and IV.
- 6. Rappaport, A. & Mauboussin, M. — Expectations Investing (2001; rev. ed. 2021). The reverse-DCF method of Part VII.
- 7. Greenwald, B., Kahn, J., et al. — Value Investing: From Graham to Buffett and Beyond (2001). Earnings power value (EPV).
- 8. Graham, B. & Dodd, D. — Security Analysis (1934); Graham, The Intelligent Investor (1949). Net-current-asset-value (“net-net”) screening; the count-gauge thermometer is a house construction on Graham’s observation that net-nets all but vanish at tops.
- 9. Mauboussin, M. & Callahan, D. — base-rate studies on the distribution of sustained corporate growth rates (Credit Suisse/Morgan Stanley research series), supporting Part VII’s “only a few percent sustain >20%/yr for a decade.”
Part I–II: regime, money, machinery
-
10. US Bureau of Labor Statistics — Employment Situation, July 2026 (released Aug 7, 2026): nonfarm payrolls −23,000; unemployment 4.1%. Consumer Price Index, July 2026 (released Aug 11, 2026): headline 3.4% y/y.
-
11. Federal Open Market Committee — statement and vote, July 29, 2026 meeting (target range 3.50–3.75%; three dissents toward a hike), federalreserve.gov.
-
12. TreasuryDirect — auction results press releases (treasurydirect.gov/instit/annceresult/press/preanre/2026/): 3-year note of Aug 11, 2026 (high yield 4.291%, bid-to-cover 2.71, primary-dealer takedown ~11.7%); 10-year note of Aug 12, 2026 (high yield 4.683%, bid-to-cover 2.53, dealer takedown 8.6%, indirect 76.7%). 30-year bond of Aug 13, 2026 (high yield 5.216% — highest 30-year auction yield since 2001; bid-to-cover 2.39; dealer takedown 11.5%; indirect 66.8%; Bloomberg pre-auction framing “highest since 2001,” when-issued talk ~5.24%). Dealer takedown as residual-demand measure per standard Treasury-market practice.
-
13. US Department of the Treasury — Quarterly Refunding Statement, August 2026 (coupon sizes held; bill-heavy financing mix).
-
14. IMF — Fiscal Monitor, April 2026 (Fiscal Policy under Pressure: High Debt, Rising Risks): US deficit 6.8% of GDP (2025), projected 7–8% through 2031 (“unprecedented in peacetime”); gross debt 123.9% → ~142% by 2031; interest 4.3% → ~5% of GDP; ~$5T of bill issuance added since COVID. Also Global Financial Stability Report (2025–26): hedge-fund share of Treasury purchases; basis-trade leverage warnings. (The 45%-of-GDP gross-financing-needs figure is press-attributed to IMF data and not yet verified against the statistical tables — Appendix F.)
-
15. Bank for International Settlements — Quarterly Review commentary on hedge-fund Treasury-futures basis positions (2024–2026 series).
-
16. Financial Times / Bloomberg — reporting of Aug 1–7, 2026: coordinated yen intervention; US Treasury sale of euro reserves without ECB consultation; FIMA repo activation. (The interpretation is the author’s; the facts are theirs.)
-
16b. Federal Reserve Bank of New York — Quarterly Report on Household Debt and Credit, Q2 2026 (Aug 11, 2026; primary release read directly): total household debt $18.771T (−$13B q/q, +$383B y/y); card balances $1.263T (+$21B); serious-delinquency transition rates — cards 6.97%, auto 3.00%, student loans 7.83%; aggregate serious delinquency 2.57%, “improved slightly”; “delinquency rates across most products have held steady over the past two years.” Stock measure (~13% of card balances 90+ days delinquent, approaching the Great-Recession-era share) per the report’s balance-share series and accompanying coverage; NY Fed research framing “K-shaped divide persists” via CNBC (Aug 11). Fitch Ratings subprime auto ABS 60+ day delinquency index at a 32-year high (coverage, Aug 2026) — the within-market K exhibit. World Gold Council-reported central-bank purchases on the order of 1,000 tonnes annually, 2022–2025 pace continuing. Sell-side gold targets, Aug 2026: JPMorgan $6,000 year-end maintained; Goldman Sachs target cut (divergence noted in Part II’s gold check).
-
16e. US Bureau of Labor Statistics — Producer Price Index, July 2026 (released Aug 13, 2026): headline 0.0% m/m (energy −3.1%); core ex-food/energy/trade +0.4% m/m, +4.7% y/y; construction +2.2%; portfolio management fees +6.5%. CME FedWatch September hike odds ~48% → ~40% across the Aug 11–13 prints. US Census Bureau — Advance Monthly Retail Trade, July 2026 (released Aug 14, 2026, 8:30 ET): −0.6% m/m vs +0.1% consensus; paired in Part VI with the same week’s PPI portfolio-management datum as the two-presses K exhibit.
-
16f. Citadel Securities — Global Market Intelligence, “August Checklist” (Aug 2026): retail net buyer returning post-June selling; household passive inflows
$1.6T YTD ($7.5B/day), July ~$350B the largest monthly total on record; average daily net put premium ~$29M (~8x one-year average); Aug 4 most active SPX-call day on record; >$1T announced buyback authorizations (authorizations, not executions — cf. ref 30). -
16g. Friar, S. / OpenAI — “AI-native finance” playbook (openai.com, Aug 10, 2026) and coverage (CFO Dive linking the publication to IPO-readiness; IR-GPT and zero-day-close reporting). The four-question AI-ROI scorecard quoted in Part V.
-
16d. Hyperscaler cash-flow inflection — Tom’s Hardware / Investing.com / CNBC (late Jul 2026): Alphabet’s first-ever negative FCF ($44.9B single-quarter capex, 2027 guided higher); Microsoft the only US hyperscaler FCF-positive; combined big-four FCF at decade lows (
$4–7B). Boyle, P. — “Why Wall Street is Ignoring Big Tech’s Debt” (YouTube, Aug 2026): the $1.65T off-balance-sheet compilation, Meta $233B/quarter commitments, the disclosure-mechanics synthesis. Academic scaffold: Sloan (1996) on accrual anchoring; Bloomfield (2002) on incomplete revelation. Demand arithmetic: The Economist ($2.5T/yr required); Bank of England executive survey; Ramp/median-firm AI spend data ($10.66/employee/month). -
16c. Capital-gains proposal reporting — CNBC / CPA Practice Advisor (Aug 12, 2026): administration weighing capital-gains indexation and enlarged home-sale exemption into the midterms; CRFB score of ~$1T added debt for the March 2026 version (Fortune, Mar 19, 2026).
-
16a. Intervention-failure record: Investing.com analysis (Jul 27, 2026 — ¥11.73T April–May operation, six-week failure, carry arithmetic); CNBC (Aug 12, 2026 — joint-operation failure); market data Aug 12 (USD/JPY ~159.3). Turkey bullion cycle: Bloomberg (Mar 26, 2026 — ~$8B drawdown); AGBI (May 2026 — reserve replenishment).
-
17. Evans-Pritchard, A. — The Daily Telegraph, August 2026, on US fiscal dominance and Fed capture risk. Origin artifact for claim file 0004; its assertions were decomposed, sourced, and given kill conditions rather than adopted.
-
18. TS Lombard — client commentary on fiscal dominance (“financing costs explode” framing), 2026.
Part III–IV: the machine and its financing
-
19. Advanced Micro Devices, Inc. — Form 10-Q for the quarter ended June 27, 2026 (SEC EDGAR): unconditional purchase commitments $30.276B (vs $25.662B at March); out-year schedule; $9.5B subsequent-event datacenter leases. Accession via EDGAR full-text and FilingSummary R-file extraction.
-
20. CoreWeave, Inc. — Q2 2026 earnings release and conference call, Aug 11, 2026; FactSet CallStreet corrected transcript via investors.coreweave.com (verified Aug 12): older-generation value framing (“older generations of infrastructure continue to have significant value”; A100 “contract that extends into 2029… this SKU was introduced in 2020”); power (1.5GW active, ~500MW added in Q2, “more power in Q2 than any single neo cloud operates in total today”); capital ($18B raised, weighted-average cost of debt −~300bps, $32B+ secured, DDTL 5.5 underwriting 2–3-year customer contracts); backlog $104B +246% y/y plus $25B+ early-Q3 commitments.
-
21. Nebius Group N.V. — Q2 2026 results, Aug 12, 2026: revenue +454% y/y, positive adjusted EBITDA. Supplier-web repricing observed same-session (author’s watchlists).
-
22. SEC EDGAR Form 4 filings — author’s sweeps: June 1–Aug 7, 2026, eleven issuers (NVDA, AMD, AVGO, AMAT, MU, LRCX, KLAC, MRVL, SMCI, DELL, CRWV): 603 open-market sales / 49 insiders / 1 open-market purchase; expanded Aug 12 to ~55 US-filer names across the full web mapped in this paper: ~3,540 sale transactions / ~136 insiders / 4 individual purchases, with TSMC’s routine executive share-purchase pattern (31 insiders, 114 buys) noted as the exception. Cross-checked against Kresmion’s June 26, 2026 analysis (63 sales vs 1 buy since June 1 across the complex), which the sweeps independently confirmed and extended. Foreign private issuers without Section 16 obligations (e.g., Fabrinet, Cameco) excluded rather than counted as absence.
-
23. SEC EDGAR full-text search (efts.sec.gov) — counterparty graphs for CRWV and NBIS; BDC portfolio-holding disclosures (Carlyle, MSD, et al. vehicles) as the visibility mechanism into the private-credit tier.
-
24. NVIDIA Corporation and partners — announcements and press reporting of Aug 10–11, 2026: AI-infrastructure financing coalition (Apollo, Blackstone, BlackRock, Brookfield, Goldman Sachs, KKR); ~$500B program; compute-collateralized SPV structure; NVIDIA participation up to 25% per deal; “investable infrastructure asset” quotation.
-
25. CDS levels — market-data reporting, Aug 2026: NVDA 5-year CDS at record wides (~69bps, wider than Alphabet’s); ORCL CDS at cycle highs. Mechanical-hedging caveat noted in text.
-
26. Burry, M. / Scion Asset Management — public commentary and 13F filings (2025–2026) on hyperscaler depreciation schedules (~$176B contention through 2028). Origin artifact for claim file 0003.
-
27. Hyperscaler nuclear commitments — company announcements and DOE materials, 2024–2026: Microsoft/Constellation Three Mile Island (Crane) 835MW restart; Amazon/X-energy and Susquehanna; Google/Kairos Power fleet order; Meta/TerraPower 4GW program; DOE loan-program support. Committed-vs-delivered tally is the author’s (claim file 0005).
-
28. Centrus Energy Corp. — HALEU production disclosures and DOE HALEU Availability Program materials: ~0.9 t/yr current output; contractual obligation ~1 tonne by March 2032; program schedule slippage. Claim file 0005.
-
29. Lucent Technologies / Nortel Networks — vendor-financing precedent: contemporaneous reporting and post-mortems of 1999–2002 CLEC vendor-finance losses; McKinsey (end-2000): ~$25.6B of vendor-financing commitments across the nine largest suppliers; Lucent $8.1B (24% of revenue, ~$3.5B written off), Nortel $3.1B, Cisco $2.4B. Current-cycle comparisons: Tunguz, “Circular Financing” (Oct 2025 — NVIDIA direct ~$110B ≈ 67% of LTM revenue); Johannsen, “Vendor Financing Loops: 1999 vs 2026” (Mar 2026 — deal-level inventory). The ~20x ecosystem multiple reconstructs from these components.
-
29a. US Treasury Fiscal Data — Monthly Statement of the Public Debt, Tables 1 and 3 (api.fiscaldata.treasury.gov), July 2026: bills outstanding $6.99T; security-level maturity ladder summing to $10.48T maturing within 12 months; basis of the gross-financing-needs reconstruction in Part II.
-
29b. FRED (Federal Reserve Bank of St. Louis) — NASDAQ100 and NIKKEI225 daily series; inputs to the melt-up trailing-stop capture measurements in Part I.
-
30. SEC XBRL companyfacts — PaymentsForRepurchaseOfCommonStock quarterly series, six issuers (author’s pull, Aug 12, 2026): GOOGL zero Q1–Q2 2026 after $15B+/qtr in 2024; META zero for three consecutive quarters; AMZN zero since mid-2022; MSFT ~$4.6B/qtr steady; NVDA $19.3B April-2026 quarter (record); AAPL ~$25B/qtr. Primary verification of the press record below. Bloomberg News (Bloomberg Intelligence, R. Schiffman) — “Big Tech Stock Buybacks Vanish as AI Spending Spree Eats Up Cash,” June 18, 2026: Alphabet’s Q1 2026 repurchase halt (first in ~a decade) and planned ~$85B equity sale; Microsoft the only big-four buyer at $3.4B (group low in nearly ten years); Meta equity-offering deliberations; Apple $100B and NVIDIA $80B counter-example authorizations; big-four 2026 capex ~$725B.
-
31. Barclays equity strategy — July 2026 (press summaries): six largest tech firms cut buybacks ~17% y/y while other sectors’ rose; the six supplied >25% of all S&P 500 buybacks in 2024–25; S&P 500 Buyback Index ~30% behind the broad index since late 2022.
-
32. Chancellor, E. (ed.) — Capital Returns: Investing Through the Capital Cycle (Marathon Asset Management, 2015). The repurchase-to-issuance sign flip as a capital-cycle marker.
Part V–VI: demand, innovation, labor
- 33. S&P Global Market Intelligence — 2025 enterprise AI survey: 42% of companies abandoned most AI initiatives (vs 17% prior year); ~46% of POCs scrapped.
- 34. Gartner, Inc. — press releases: >40% of agentic AI projects to be canceled by end-2027 (June 2025); ~30% of GenAI projects abandoned after POC (2024).
- 35. McKinsey & Company — The State of AI (2025 edition): ~88% adoption; ~39% reporting measurable EBIT impact.
- 36. Verisk / ISO — generative-AI exclusion endorsements for commercial general liability programs (2025–2026 filings), plus law-firm client-alert corpus tracking adoption.
- 37. Moffatt v. Air Canada, 2024 BCCRT 149 — the delegation-does-not-launder-liability precedent.
- 38. Token-price deflation (~10x/yr) — public model-API price histories (OpenAI, Anthropic, Google, DeepSeek) 2023–2026; consistent with a16z and Epoch AI compilations. Inference-margin trajectory from 2026 press reporting on frontier-lab unit economics.
- 39. Labor-share literature — post-1980 productivity/compensation divergence: BLS productivity and costs series; Karabarbounis & Neiman, “The Global Decline of the Labor Share,” QJE (2014). Supporting the K-amplification pillar.
- 40. CXMT memory-sector shock (July 2026) and China industrial-iteration cases (solar, batteries, shipbuilding, EVs) — press and industry reporting; the iteration-model framing is the author’s synthesis.
Part VII: valuation inputs
-
41. SEC XBRL APIs — companyfacts and frames endpoints (data.sec.gov) for all fundamental inputs to the reverse-DCF and EPV computations in Part VII’s table; prices as of Aug 11–12, 2026 from the author’s platform feed. WACC assumptions ~8.5–9.5% by name; computations reproducible with the tooling described in Appendix C.
-
42. ICE BofA option-adjusted spread series via FRED (BAMLC0A0CM 79bp; BAMLH0A0HYM2 271bp; values of Aug 12, 2026, retrieved Aug 13) — Part IV third-tension counter-exhibit; percentile placements computed on the trailing three-year window.
-
43. Oracle $25B eight-tranche offering, Feb 2, 2026 — TwentyFour Asset Management commentary and IFR deal reporting (order book ~$129–155B, a record; ~30bp tightening from initial talk; secondary rally on announcement). Oracle CDS repricing (~45 → 200+) and July 2026 S&P downgrade to BBB− per ratings coverage.
-
44. Official-sector examinations of AI circular financing, 2026: IMF Global Financial Stability Report, April 2026, Ch. 1 (“the impact on financial stability appears modest currently”); Bank of England Financial Stability Report, July 2026 (five hyperscalers ≈3% of outstanding US IG stock vs >15% of YTD issuance; AI issuers 41% of non-refinancing US HY issuance vs ~1% of index stock); Federal Reserve Financial Stability Report, May 2026; FSB private-credit report, May 2026.
-
45. Demand-slope exhibits, Part V: Anthropic run-rate series ($9B Dec 2025 → $47B May 2026) compiled from funding/partnership disclosures (S. Willison, May 29, 2026; VentureBeat corroboration); OpenAI ~$25B run-rate reported flat Feb→mid-2026 with ~$14B projected 2026 loss (The Information / FT-derived reporting); Microsoft FY2026 Q4 release (commercial RPO $678B +84%; Azure >$100B FY, +43%); Alphabet I/O 2026 keynote (tokens 9.7T → 3.2 quadrillion/month, May 2024→May 2026); Ramp AI Index, August 2026 (“Cracks in the AI thesis”; median firm spend $11.95/employee/month).
-
46. Tunguz, T. — “Circular Financing: Does Nvidia’s $110B Bet Echo the Telecom Bubble?” (Oct 3, 2025): the equity-vs-receivables structural distinction (Lucent FY2000 vendor-financing commitments ~$15B, receivables to leveraged CLECs) against NVIDIA’s disclosed equity positions. Erosion watch: CNBC (Jul 27, 2026) on reported NVIDIA–OpenAI backstop discussions up to $250B.
-
47. “The Counterparty Brief — The Case Against The Securitization of Intelligence” (bleenq intelligence adversarial review series, Aug 13, 2026): the commissioned free-rein review whose surviving objections are absorbed in v2.1; companion document in the paper’s record.
-
48. NVIDIA Newsroom (Aug 10, 2026) — AI compute financing platforms with Apollo, BlackRock, Blackstone, Brookfield, Goldman Sachs, KKR (>$500B third-party capital; “subject to execution of the final agreements”). Residual-value support: Huang remarks Aug 11 via Bloomberg (“guaranteeing as much as 25%… residual value mechanism”) and Fortune (Aug 12); no mechanics in the primary release — sourcing grade noted in text. NVDA 5-yr CDS 73bp (Bloomberg, Aug 11). Burry, M. — “Trading Post August 13, 2026” (Substack) and X: “Wall Street stunt… Meet the new Boss”; “my base case is 2028.” BIS Annual Economic Report 2026 (Jun 29) and BIS Bulletin No. 128, “AI disruption in private credit: exposure to software firms in BDCs” (Jul 14, 2026); FSB, “Vulnerabilities in Private Credit” (May 6, 2026), Graph 8. Note of record: a circulating “~40% of private credit loans have positive FCF, per BIS” statistic could not be located in any BIS or FSB primary and is treated as unattributed.
Appendix F — Open review register#
A paper that scores its own predictions should also disclose its own soft spots. The following are known and tracked, in roughly descending order of load-bearing weight:
- 1. CoreWeave call artifacts (E1–E5): VERIFIED against the FactSet CallStreet corrected transcript (Aug 12) and reconciled in this revision. Outcomes: the capital-restructuring and 2029-on-2020-hardware artifacts confirmed verbatim; the value-tier framing confirmed in substance (“value token processing” was our compression, not their phrase); the power claim materially corrected (1.5GW is total active power, ~500MW added in Q2, and the comparison was to neoclouds’ totals — “more than any hyperscaler” was not said); the slot-opportunity-cost “question” was our synthesis, not an analyst’s words, and is downgraded to a house question, still unanswered. Part III and Part V reflect the corrected record. The live-listening calibration lesson is itself logged: substance reliable, specifics need the document.
- 2. Gross financing needs — CLOSED, fully. Reconstructed from the security-level maturity ladder (Treasury MSPD Table 3, July 2026): $10.48T of marketable debt matures within 12 months — bills $6.99T (cross-validating Table 1 to the decimal) plus $3.49T of notes/bonds/TIPS/FRNs — plus a ~$2.1T deficit = $12.55T against ~$29.5T GDP = 42.5% of GDP, a schedule pull with no estimated components, corroborating the press-attributed ~45%.
- 3. The ”~$6T rolled per quarter” — CLOSED as labeled. Confirmed as a gross-issuance/bill-churn measure and now labeled as such in Part II; $7T of bills turning several times yearly plus coupon rollovers makes the order of magnitude arithmetic, not attribution.
- 4. The “~20x telecom vendor financing” — CLOSED. Reconstructed from era figures: ~$25.6B across nine suppliers at end-2000 (McKinsey; Lucent $8.1B/24% of revenue, Nortel $3.1B, Cisco $2.4B) vs ~$110B of NVIDIA direct commitments (67% of revenue) plus the $500B SPV program → ~20x+ holds; NVIDIA-direct alone is ~4x the entire telecom complex and ~3x Lucent’s revenue-relative peak. Part IV now carries the numbers.
- 5. Melt-up trading heuristics — CLOSED BY MEASUREMENT, and partially corrected. Trailing-stop simulations on FRED daily closes across NDX 1999–2000, Nikkei 1989, and NDX 2021: 10–15% trails captured ~40–70% of the melt-up gain (best case 69%; worst configurations whipsawed or exited below entry), so the old “middle 60%” line was the best case, not the base case — Part I now carries the measured range. The retrace claim strengthened under measurement: all three episodes gave back >100% of the melt-up’s entire gain (156%/284%/202%).
- 6. Insider ledger dollar-weighting — CLOSED. $7.9B sold vs $35.5M bought (222:1); individuals excluding fund vehicles: ~$0.5M bought (dollar ratio in the thousands to one). TSMC base-rate check run: no pre-2026 Form 4 baseline exists (filings begin March 2026), and the 2026 purchases average ~$13K — plan-accumulation fingerprint, not conviction sizing. Part III updated.
- 7. The calibration record’s sample is small (~14 legs) — REMAINS OPEN by nature; grows with time only.
- 8. Instrumentation not yet built — REMAINS OPEN (build queue): GPU spot-rental price series, datacenter vacancy/lease-rate tracking, SPV advance-rate monitoring (first deals pending — the single most informative number coming), and an ISO AI-exclusion adoption tracker, and — addressing Part I’s measured 40–70% melt-up capture ceiling — a momentum-aligned adaptive trailing exit under pre-registered validation (parameters fit pre-2026, judged out-of-sample; it enters this paper only if it survives).
- 9. Single-source dependencies — PARTIALLY CLOSED. The NVDA CDS record (~69bps, above Alphabet’s) is now corroborated across multiple independent outlets; the euro-reserve intervention detail still rests on FT/Bloomberg reporting (two outlets, one likely upstream source) and is labeled accordingly.
- 9a. The author’s performance figure (+225%, 3 years, long-only) is a personal-account statement under active verification against broker records: the full E-Trade statement archive (153 documents, 2019–2026, both format eras) has been retrieved and parsed, with per-account value chains reconciling to the penny; return computation (TWR/Modified Dietz) and the masked worksheet are in progress. The claim is published with that status explicitly until the computation is attached — and if the computed figure differs, the paper corrects to the computed figure.
- 9b. The $1.65T off-balance-sheet aggregate is a secondary compilation (Boyle, from disclosed footnotes) — directionally consistent with our own AMD primary pull; full reproduction from the five issuers’ filings is queued (the FilingSummary pipeline makes it a day’s work).
A note on what is deliberately not cited: narrative-tier secondary content (YouTube market commentary, viral statistics, unsourced “insider” claims) was consumed as a lead-generation layer during research and appears nowhere in this paper’s evidentiary chain except where its claims were re-derived from primary sources — several were checked and failed (stale prices, prior-quarter results wearing current headlines, “fraud whistleblower” claims that on inspection were hedged opinion). The season’s operating lesson: the feed is for hypotheses; EDGAR is for facts.
© 2026 Paul Vilevac / bleenq LLC. Personal research; not investment advice. See disclaimers on page 1. Corrections and counter-evidence actively solicited — the claim files have intake formats for both.